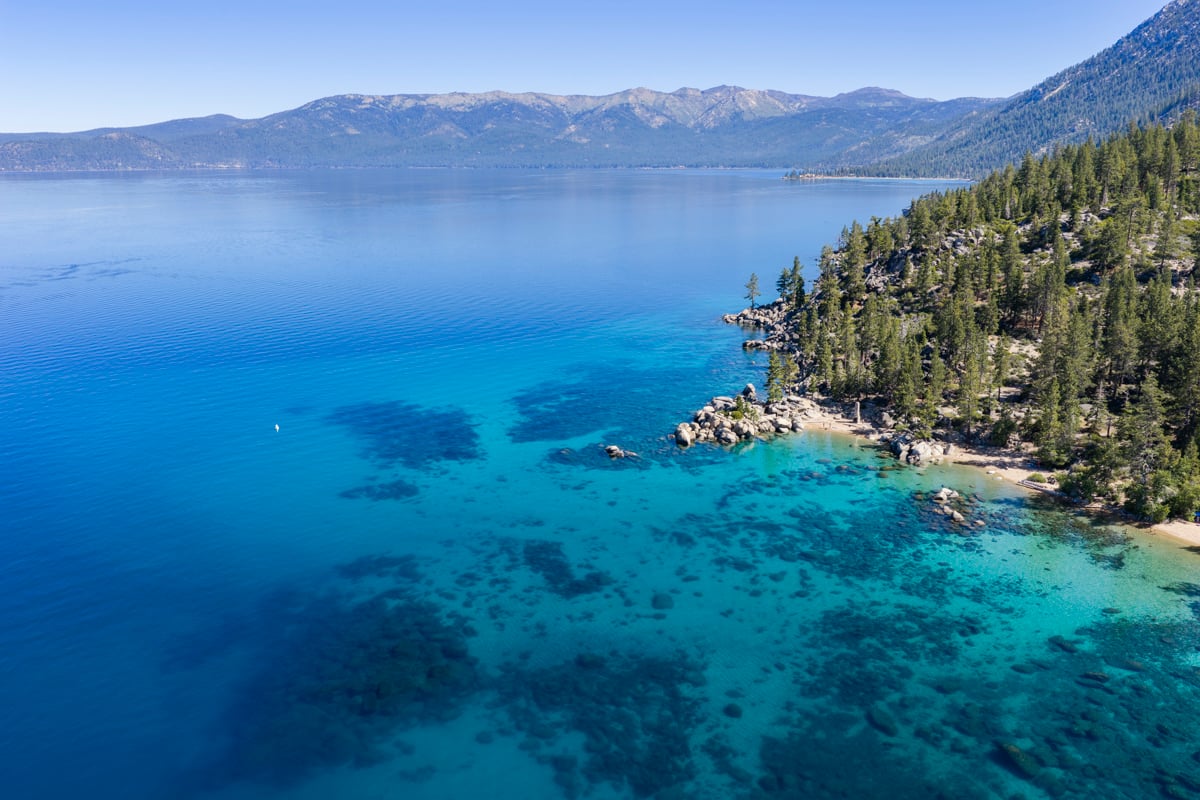
INCLINE VILLAGE & CRYSTAL BAY · LAKE TAHOE
Mid-Year Market Report
January – June 2026
by Ming Poon
Published July 2026 · Your Tahoe-Truckee Market Intelligence
FIRST HALF AT A GLANCE
Total Transactions
85 closed sales vs. 58 in H1 2025 (+46.6%)
Total Volume
$376.2 million vs. $133.8M in H1 2025 (+181.2%)
Median Sale Price
$2,500,000 vs. $2,050,000 in H1 2025 (+21.9%)
SF Median Price
$2,725,000 vs. $2,100,000 in H1 2025 (+29.8%)
Condo Median Price
$1,540,000 vs. $1,485,000 in H1 2025 (+3.7%)
Median Days on Market
68 days vs. 80 days in H1 2025 (-15.0%)
Avg Sale / List Ratio
95.8% vs. 95.0% in H1 2025 (+0.8 pts)
Median Price / Sq Ft
$923 vs. $830 in H1 2025 (+11.2%)
EXECUTIVE SUMMARY
A Historic First Half
85 transactions. $376.2 million in volume. A $46 million lakefront record. The first half of 2026 didn't just outperform 2025 — it reset the baseline for what this market is capable of.
H1 2025 produced 58 transactions and $133.8 million. H1 2026 more than doubled that volume, added 27 additional closings, and delivered a median price 21.9% above where it stood twelve months ago. By nearly every measure, the first six months of 2026 outperformed the prior year by a margin that demands explanation, not just documentation.
Three forces converged simultaneously. First, the February sale of 919 Lakeshore Boulevard at $46 million anchored the MLS volume figure—one of the largest residential transactions ever recorded in Lake Tahoe, with Tahoe Mountain Realty representing both buyer and seller. Since the close of H1, however, an off-market lakefront estate reportedly sold for approximately $125 million, together with an adjoining parcel for approximately $7 million, establishing a new benchmark for Incline Village with a combined transaction value of roughly $132 million. While not included in the MLS statistics presented in this report, the transaction provides important context for the continued strength of Tahoe's ultra-luxury market. Second, ten closings above $10 million versus one in H1 2025. Third, 63 of 85 H1 closings came in under $4 million, confirming that demand is not narrowly concentrated in trophy assets.
The internals are equally compelling. Median days on market compressed from 80 to 68. The average sale-to-list ratio rose to 95.8% — and in May hit 97.2%, the highest monthly reading in the dataset. Seven of June's 21 closings transacted at or above list price.
The single-family segment drove 92.5% of H1 dollar volume at a median of $2.725 million — up 29.8% year-over-year. That repricing is broad-based, not outlier-driven.
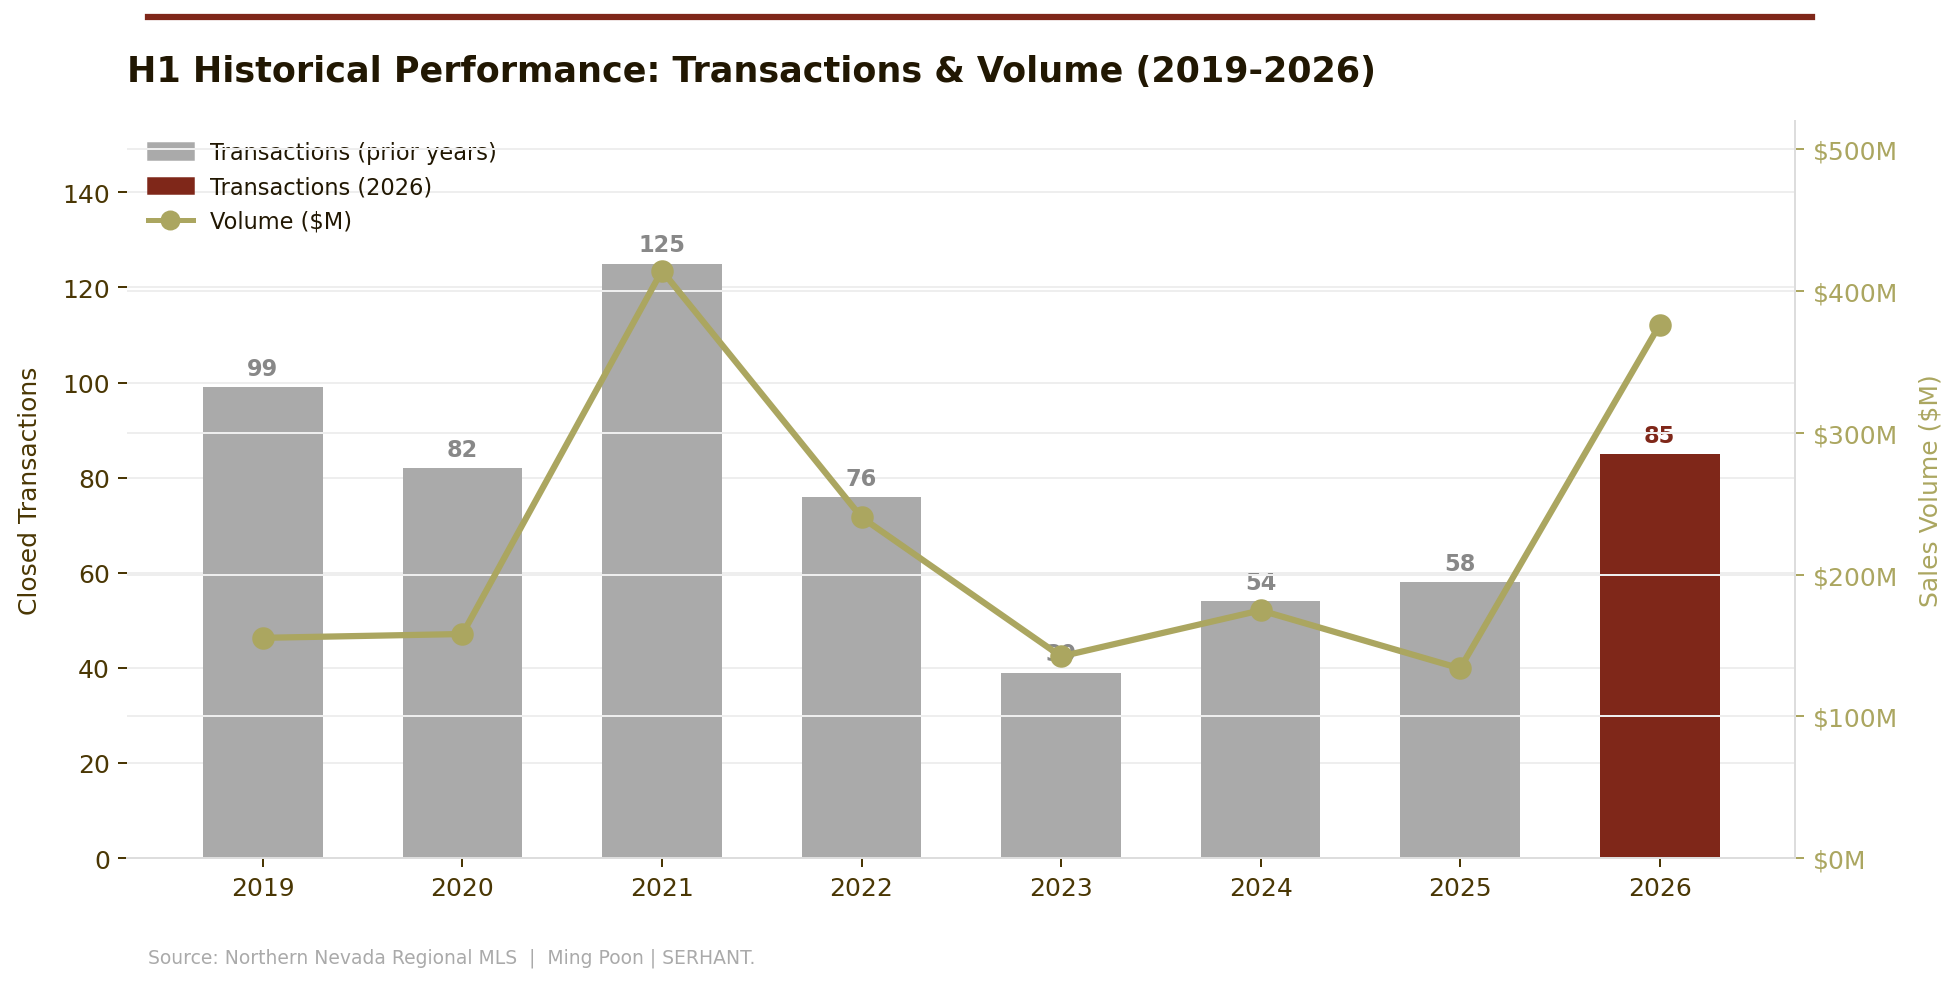
Figure 1: H1 Closed Transactions & Volume by Year, 2019–2026. The 2026 bar (sienna) represents the strongest H1 by dollar volume since 2021, with 85 transactions and $376.2M.
MONTH-BY-MONTH
How the Half Unfolded
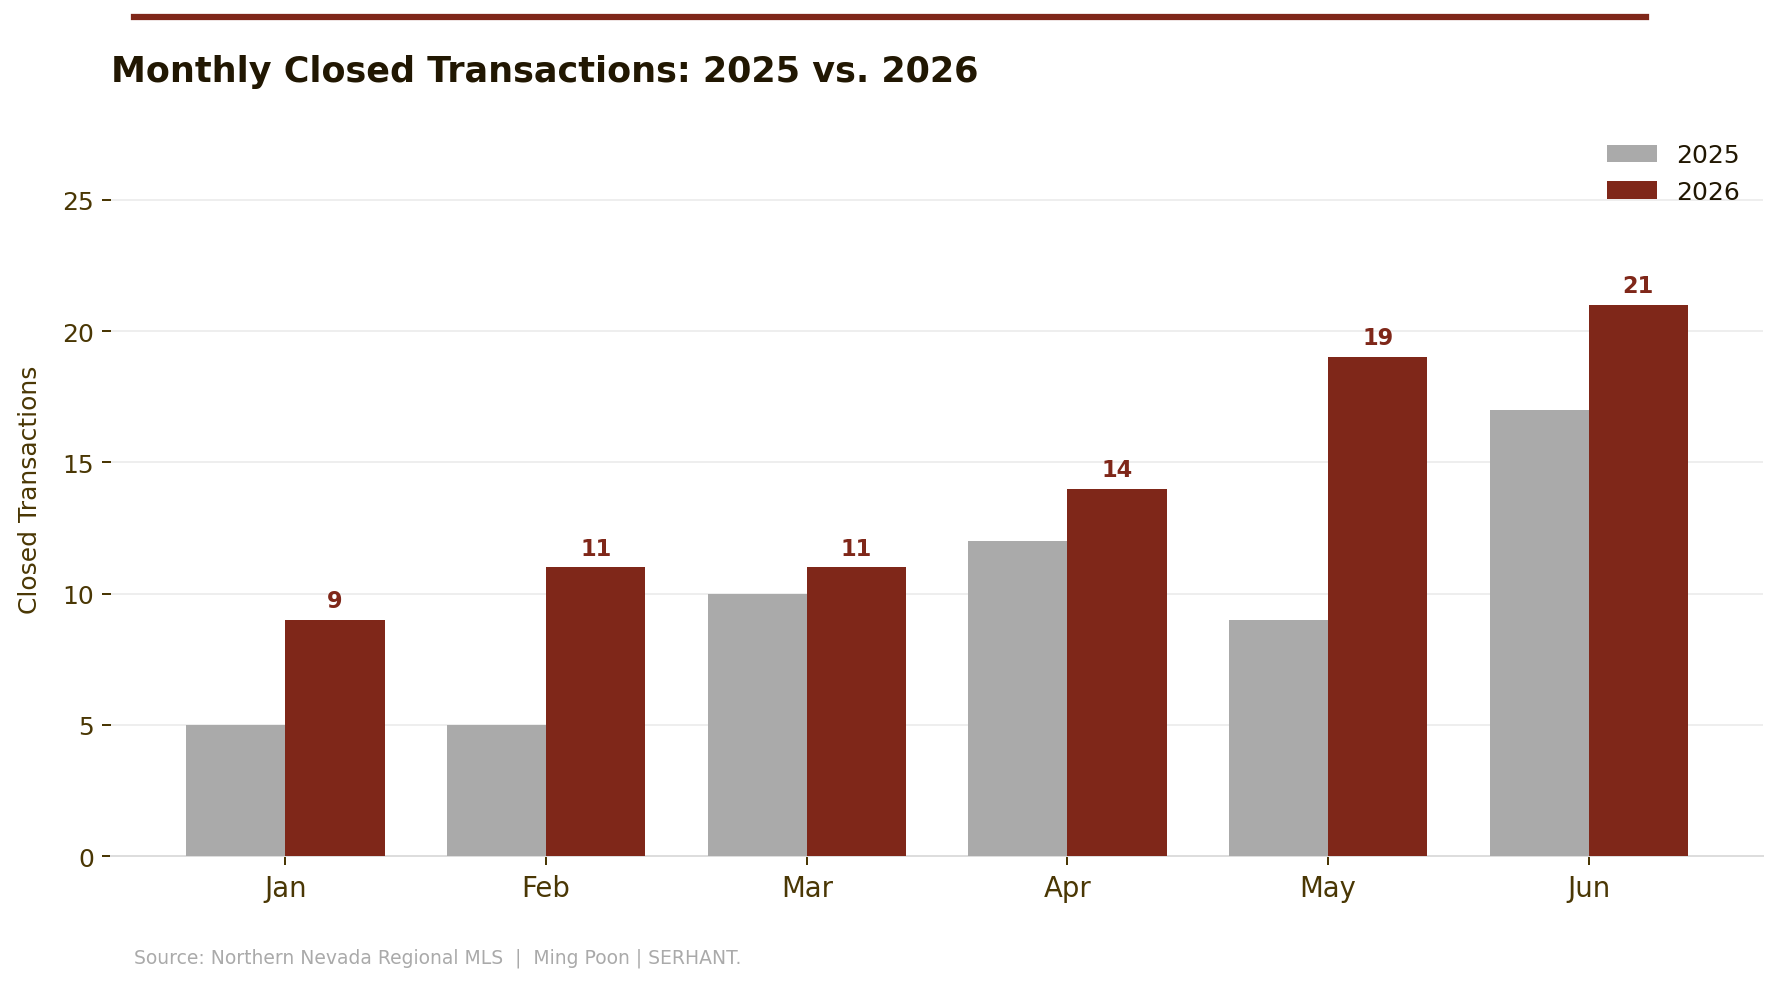
Figure 2: Monthly closed transaction count, 2025 vs. 2026. Every 2026 month except June matched or significantly exceeded its 2025 equivalent.
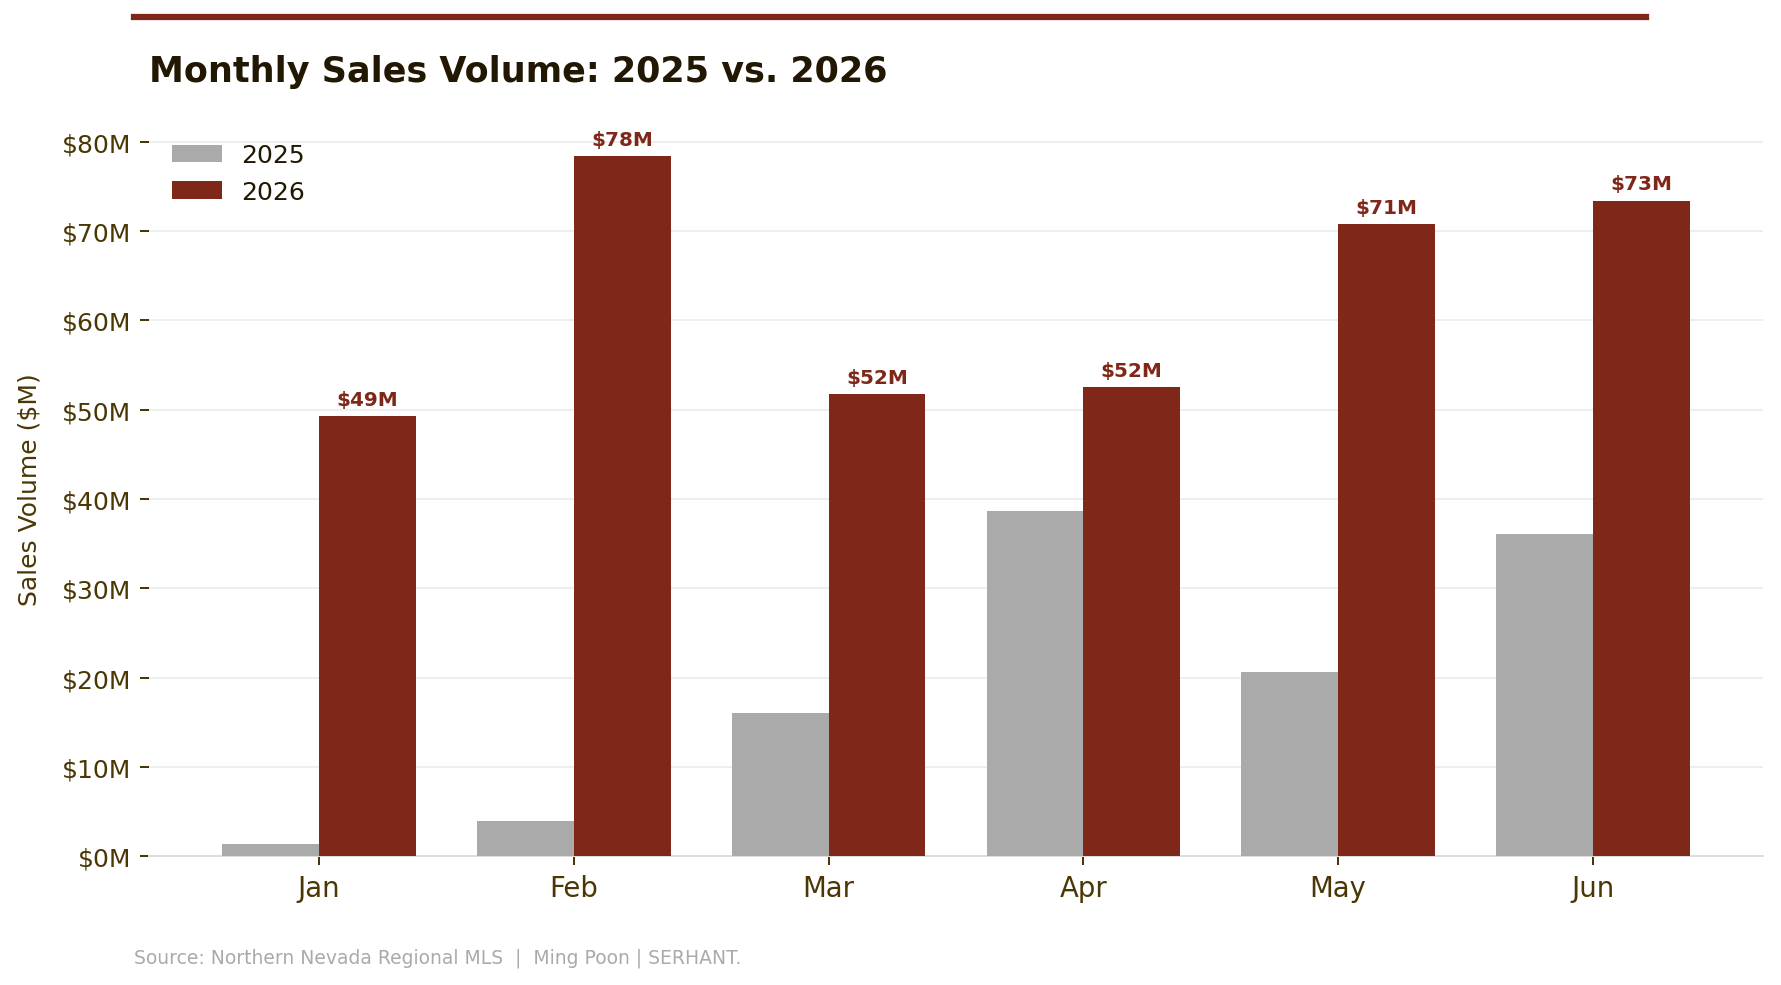
Figure 3: Monthly sales volume in $M, 2025 vs. 2026. The January–February combined volume of $127.7M reflects the $46M Lakeshore Boulevard record closing.
January & February: A Record Sets the Tone
Twenty closings. $127.7 million in volume. In two months, the 2026 market had matched 95% of H1 2025's entire output. The 919 Lakeshore Boulevard sale at $46 million on February 13th was the defining transaction — one of the largest residential sales in Lake Tahoe's history. Strip it out and January–February still generated $81.7 million across 19 transactions, well above any comparable prior winter period.
Four additional transactions cleared above $8 million: 759 Burgundy Road ($12.9M), 575 Fairview Boulevard ($12.675M), 106 Slott Peak Court ($10.2M), and 533 Driver Way ($8.0M).
A 95.0% SP/LP and 72-day median DOM signaled disciplined pricing, not a frenzy.
March: A Pause, Not a Retreat
11 closings at 146-day median DOM — the quietest month. The elevated DOM reflects fall 2025 listings finally clearing after extended market time, not softening demand. March's median price of $2.76 million was the highest of any month in H1. The 93.8% SP/LP reflected sellers who had already absorbed price reductions before closing. The pipeline entering April was clean.
April: Rhythm Returns
14 closings, $52.5M, median DOM halved to 70 days, SP/LP back to 95.3%. The standout was 740 Lakeshore Boulevard at $20 million in 18 days — a lakefront-adjacent property with community beach, pier, and pool amenities. April also logged the half-year's lowest close at $675,000, confirming well-priced entry-level condo product still moves.
May: Peak Velocity
The strongest month by every internal metric: 19 closings, $70.8M, 97.2% SP/LP, 45-day median DOM. Year-over-year, May transaction count more than doubled and volume more than tripled. Five properties closed at or above list price, including two at zero days on market.
701 Fairview Boulevard closed at $11.709M at 109.4% of list price — a rare overask in the luxury segment. 577 Poco Court ($6.499M) closed in zero days at full ask.
June: Lakefront Season Arrives
21 transactions — the highest monthly count of H1 — and $73.4M in volume. Three Lakeshore-address closings totaling $31.8M defined the month: 260 Northlake Circle (Crystal Bay) at $13.8M, 726 Lakeshore at $10M, and 1709 Lakeshore at $8M in zero days at full ask. Seven of 21 closings transacted at or above list. Eight expired/withdrawn listings in the June file confirm the pattern: correctly priced product clears in weeks; aspirationally priced product does not clear at all.
PRICING & MARKET VELOCITY
Price, Pace & Negotiating Power
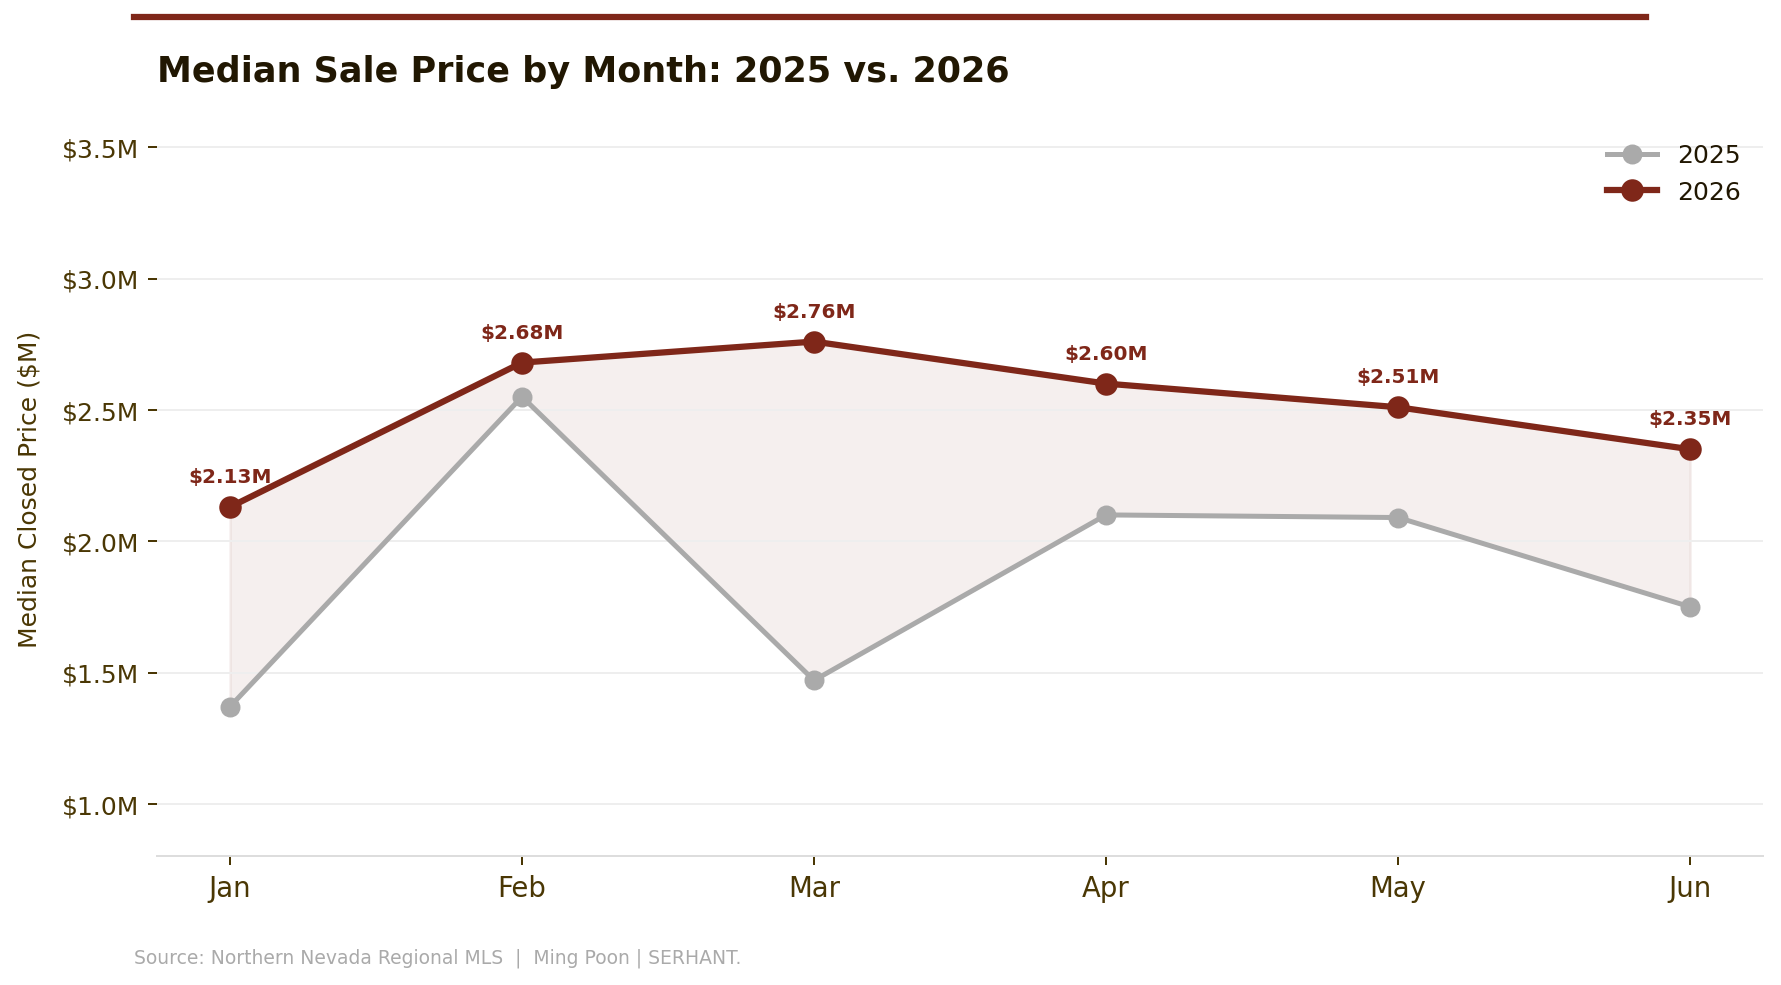
Figure 4: Monthly median sale price, 2025 vs. 2026. The 2026 line holds consistently above 2025 across all six months, with March 2026 reaching the half-year high of $2.76M.
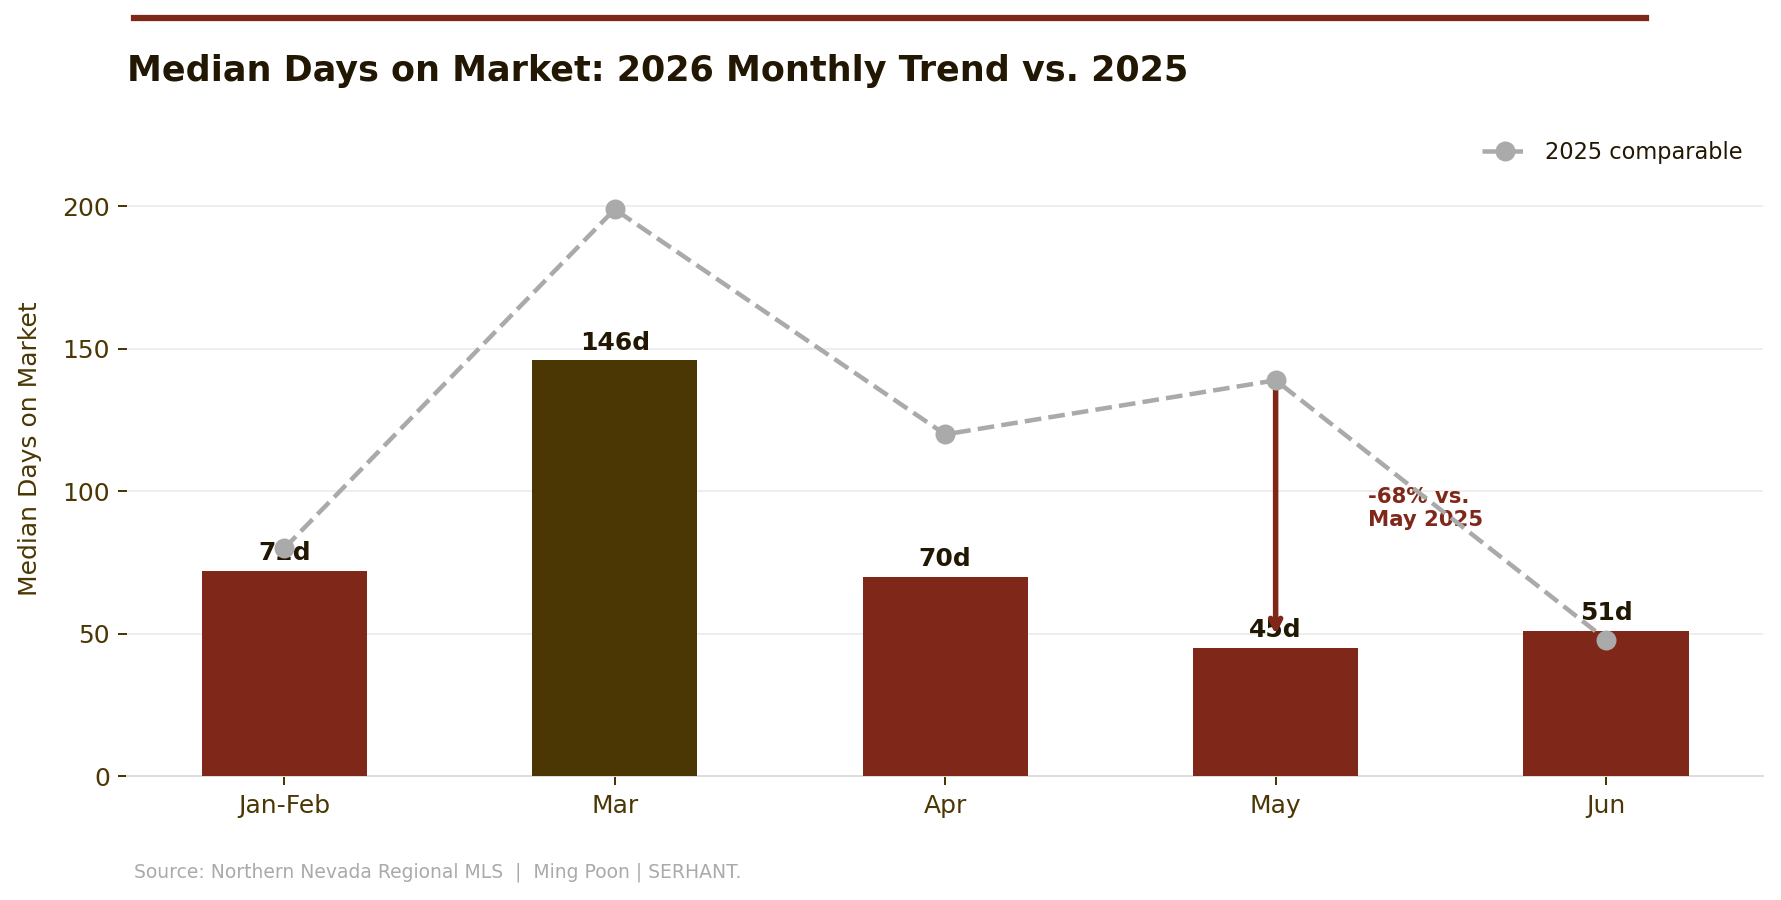
Figure 5: Median days on market by month, 2026 (bars) vs. 2025 comparable (dashed line). March's 146-day reading reflects backlog clearing; the April–June compression to 45–70 days reflects current market tempo.
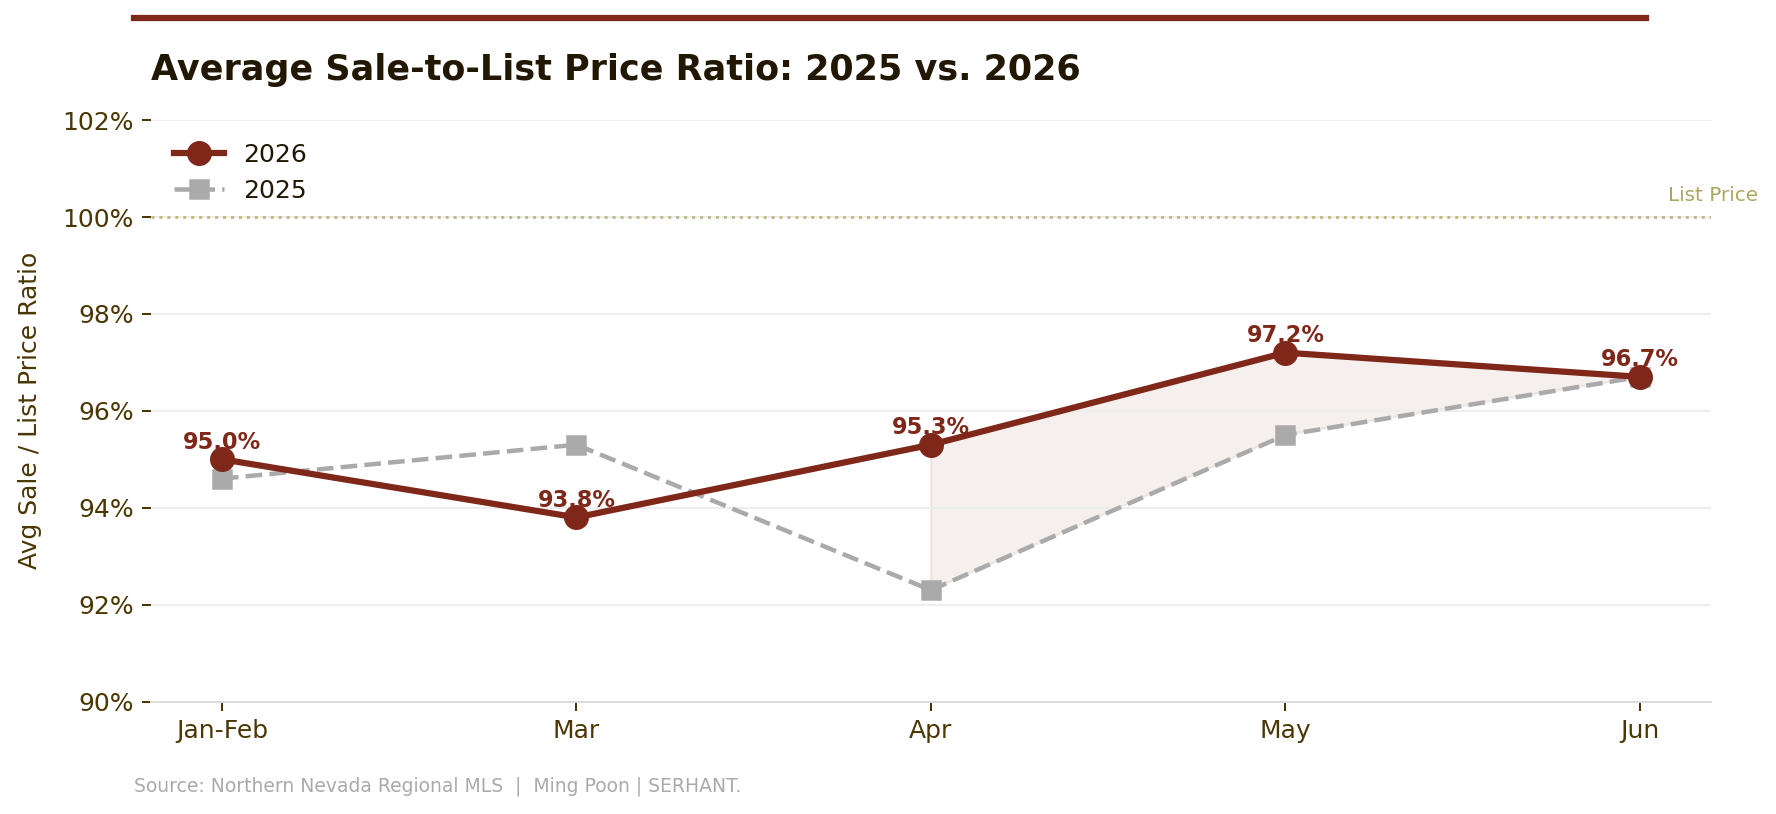
Figure 6: Average sale-to-list price ratio by month, 2025 vs. 2026. May 2026's 97.2% is the highest reading in the dataset. Seven June closings transacted at or above list price.
SEGMENT ANALYSIS
Single-Family, Condos & Lakefront
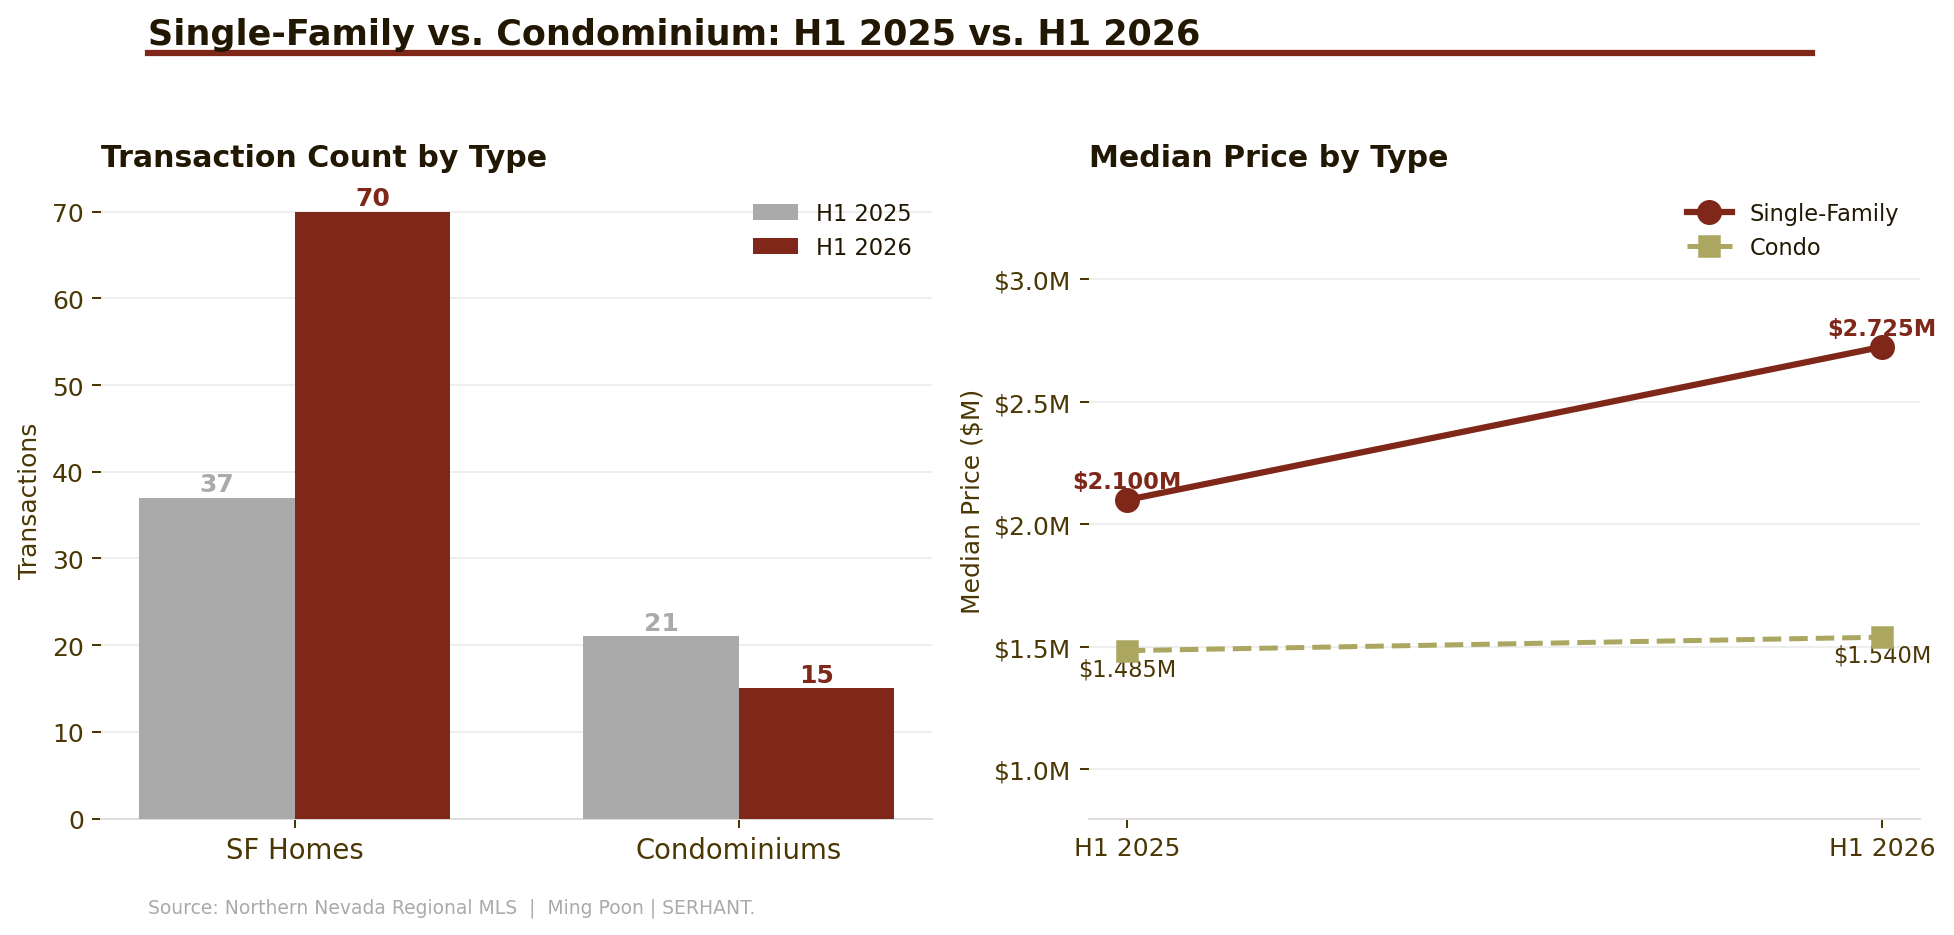
Figure 7: Left — Transaction count by property type, H1 2025 vs. H1 2026. SF volume surged while condo count declined, reflecting supply contraction rather than demand weakness. Right — Median closed price by type.
Single-Family: The Engine of 2026
70 of 85 H1 closings were single-family homes, generating $348.1M at a median of $2.725M — a 29.8% year-over-year increase. That repricing is broad-based: remove every sale above $10M and the median barely moves. The core $2M–$3.5M tier is trading faster and at higher prices because inventory has not kept pace with buyer interest, and buyers in this market — motivated by Nevada's tax advantages — are not rate-sensitive in the way primary-home buyers are. April through June ran 45–70 days on market; correctly priced homes are finding buyers in six to ten weeks.
Condominiums: Thin and Quietly Interesting
15 condo closings versus 21 in H1 2025 — fewer transactions, modestly higher median ($1.54M vs. $1.485M). The story is supply, not demand. Sub-$1M condo inventory has nearly vanished as owners sitting on 2020–2021 gains choose not to sell. The effective condo buyer has moved up-market, clustering in the $1.3M–$2.8M range. Quality condo listings in the $1.1M–$1.8M range going into H2 will be absorbed efficiently.
The Lakefront Market: A Category Reborn
Six lakefront transactions. $109.8 million in combined volume. 29.2% of total H1 dollar output from six properties.
919 Lakeshore Blvd | $46,000,000 | Feb 13 | 0 DOM | Panoramic Lake |
740 Lakeshore Blvd | $20,000,000 | Apr 6 | 18 DOM | Filtered Lake / Peek Lake |
260 Northlake Cir (Crystal Bay) | $13,800,000 | Jun 8 | 80 DOM | Panoramic Lake | 86.8% of ask |
726 Lakeshore Blvd | $10,000,000 | Jun 2 | 53 DOM | Filtered Lake / Mountain |
1709 Lakeshore | $8,000,000 | Jun 1 | 0 DOM | Panoramic Lake | Full ask |
771 Lakeshore Blvd | $5,600,000 | Feb 12 | 34 DOM | Peek Lake |
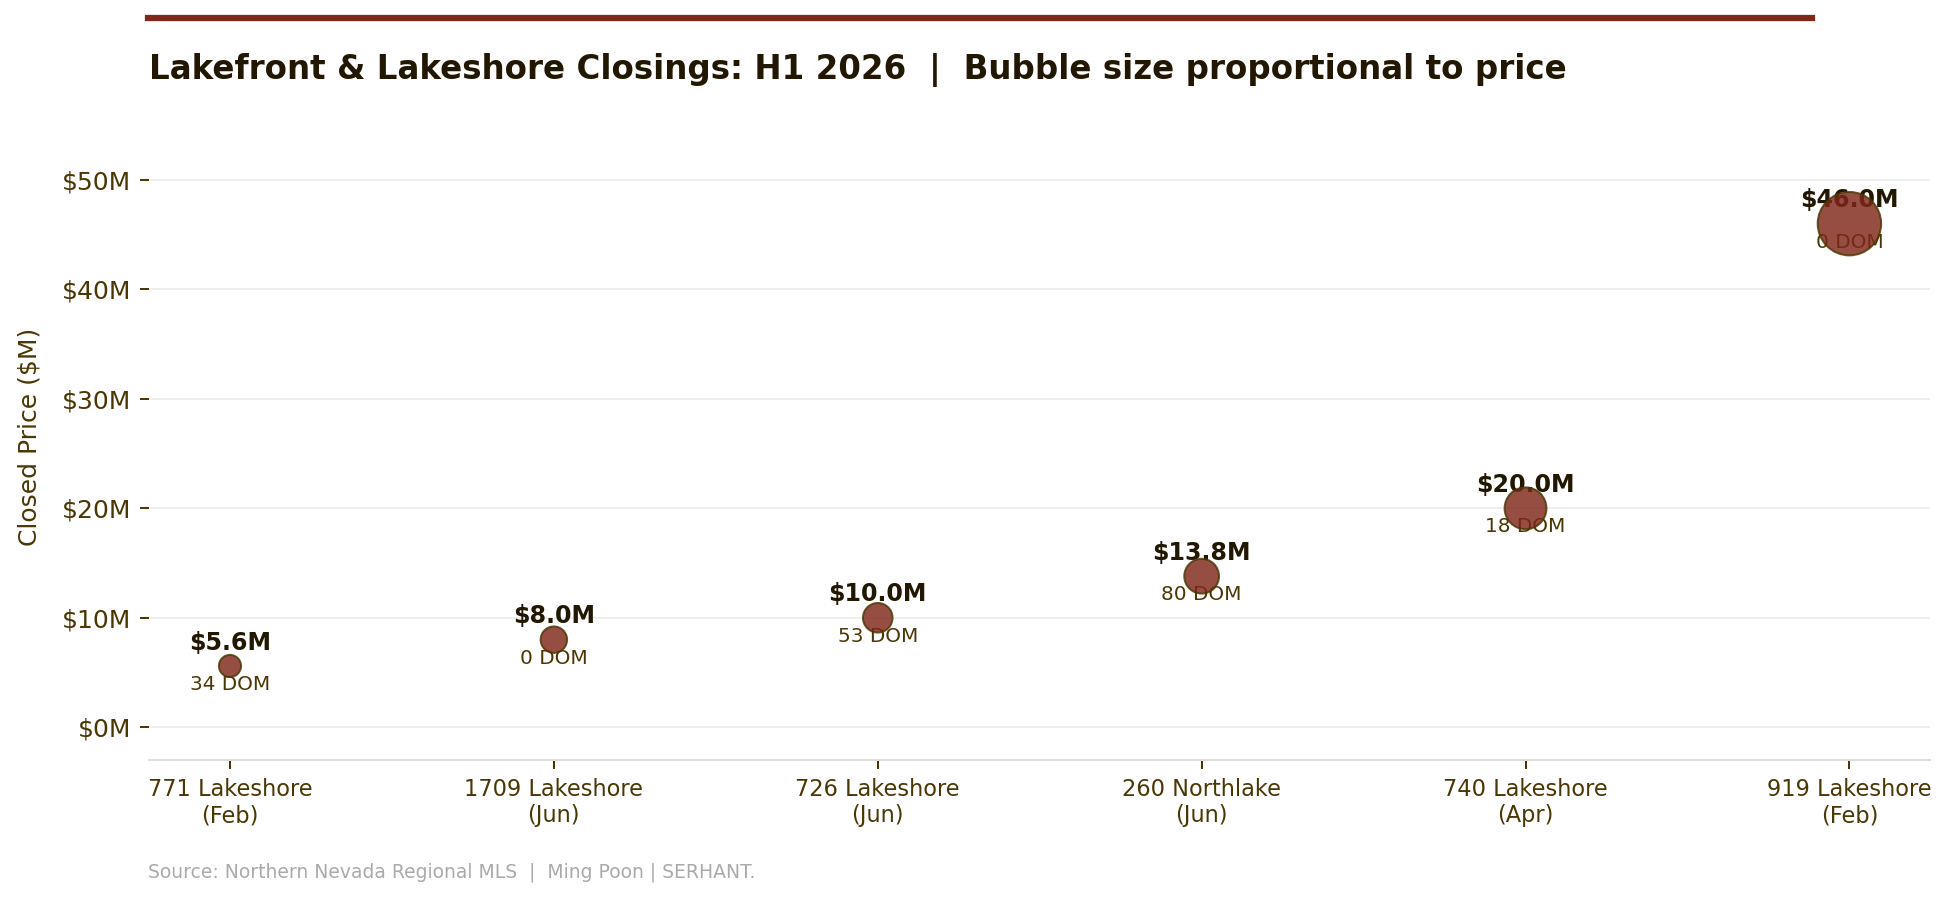
Figure 8: Lakefront and Lakeshore closings, H1 2026, ordered by price. Bubble size is proportional to closed price. Zero-DOM closings (919 and 1709 Lakeshore) indicate off-market or pre-market transactions.
The two zero-DOM lakefront closings confirm that the best-positioned lakefront properties are trading before they fully reach the open market. Lakefront sellers watching 2026 results are taking note; buyers should be prepared to move quickly — the window between introduction and contract on correctly priced lakefront has compressed to days, not weeks.
PRICE DISTRIBUTION & HISTORICAL CONTEXT
Where the Market Transacted
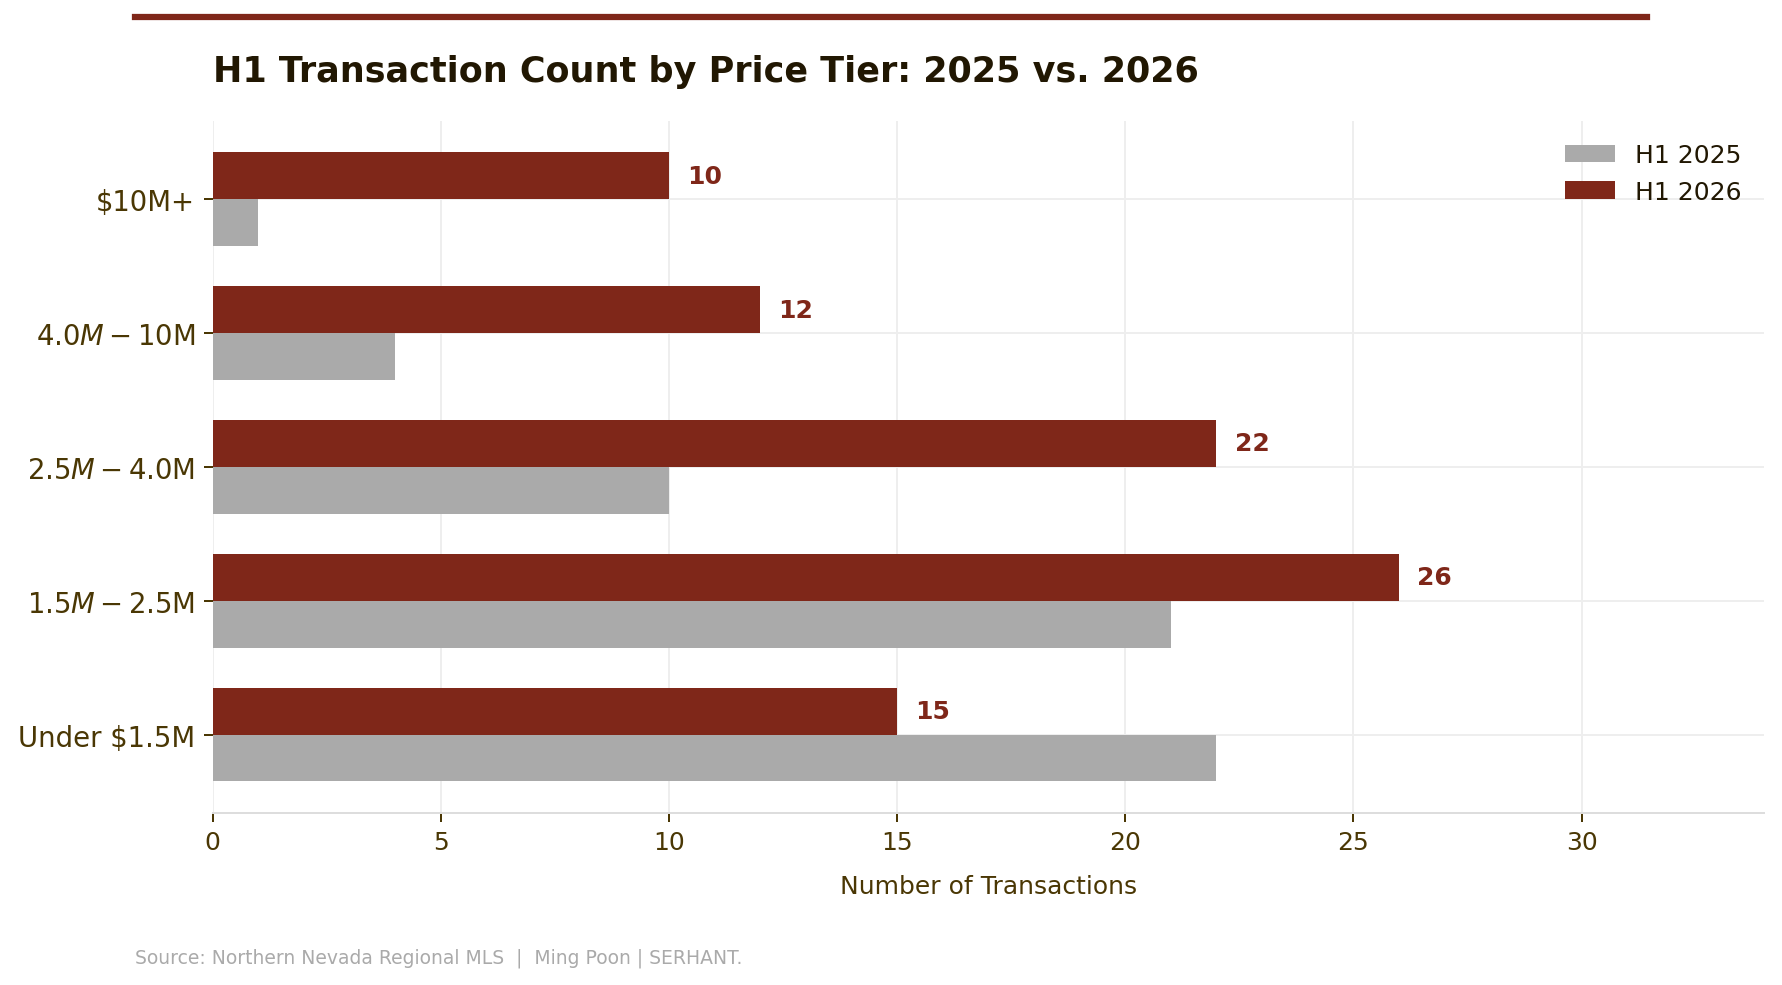
Figure 9: H1 transaction count by price tier, 2025 vs. 2026. Every tier above $1.5M posted meaningful gains. The sub-$1.5M contraction reflects supply withdrawal, not demand weakness.
The price band data tells a story of upward migration across the entire distribution. Every tier above $1.5M posted meaningful year-over-year gains. The only tier that contracted — sub-$1.5M — reflects supply withdrawal: owners of entry-level product are choosing not to sell into a market where replacement costs have risen sharply. The $2.5M–$4M tier's 120% transaction increase is particularly significant, reflecting the move-up buyer deploying California equity into Nevada.
The $10M-plus tier's ten transactions versus one in H1 2025 is largely explained by the lakefront cluster above. Normalized for the $46M record, the top tier still showed meaningful depth — a reflection of a genuine ultra-luxury buyer pool, not a single anomalous event.
PRICE TIER | H1 2026 | VOLUME | % OF VOL | VS. H1 2025 |
|---|---|---|---|---|
Under $1.5M | 15 (17.6%) | $18.1M | 4.8% | -31.8% |
$1.5M - $2.5M | 26 (30.6%) | $49.2M | 13.1% | +23.8% |
$2.5M - $4.0M | 22 (25.9%) | $66.8M | 17.8% | +120.0% |
$4.0M - $10M | 12 (14.1%) | $67.5M | 17.9% | +200.0% |
$10M+ | 10 (11.8%) | $174.6M | 46.4% | +900.0% |
FORWARD OUTLOOK
The Second Half and Beyond
As of July 2026: 20 active listings, 10 contingent contracts, 1 pending transaction. The pipeline supports continued strong summer volume.
What to Expect in H2 2026
The $2M–$3.5M single-family tier remains the core competitive zone. Correctly priced homes in this range are closing in under 60 days at 97–100% of ask. Sellers weighing the market should not wait for conditions that are unlikely to be materially better than today's.
Condos in the $1.1M–$1.8M range represent the clearest opportunity for buyers who have been priced out of the SF market. Supply is thin; well-maintained units in this range will clear quickly if priced correctly.
Lakefront will be selective but present. Two zero-DOM lakefront closings in H1 demonstrate that the right property with the right positioning transacts immediately. Overpriced lakefront — eight expired/withdrawn listings in the June file make this clear — does not.
A normalized H2 of 55–70 transactions at a median in the $2.4M–$2.8M range would close 2026 as the strongest full-year performance by volume since 2021 — and potentially the strongest dollar-output year in this market's recorded history.
The risks are weighted to the upside. The buyer pool is cash-heavy, motivation-driven, and structurally durable. A rate decline adds depth; a rate increase compresses velocity without forcing price corrections, given who is buying here.
DATA REFERENCE
Key Statistics
H1 2026: Month-by-Month
MONTH | CLOSINGS | VOLUME | MEDIAN PRICE | DOM (MED.) | SP/LP AVG |
|---|---|---|---|---|---|
Jan-Feb 2026 | 20 | $127.7M | $2,350,000 | 72 | 95.0% |
Mar 2026 | 11 | $51.7M | $2,760,000 | 146 | 93.8% |
Apr 2026 | 14 | $52.5M | $2,600,000 | 70 | 95.3% |
May 2026 | 19 | $70.8M | $2,510,000 | 45 | 97.2% |
Jun 2026 | 21 | $73.4M | $2,350,000 | 51 | 96.7% |
H1 2026 Total | 85 | $376.2M | $2,500,000 | 68 | 95.8% |
H1 2025 vs. H1 2026
METRIC | H1 2025 | H1 2026 | CHANGE |
|---|---|---|---|
Total Transactions | 58 | 85 | +46.6% |
Total Volume | $133.8M | $376.2M | +181.2% |
Overall Median | $2,050,000 | $2,500,000 | +21.9% |
SF Median Price | $2,100,000 | $2,725,000 | +29.8% |
Condo Median Price | $1,485,000 | $1,540,000 | +3.7% |
Median $/SqFt | $830 | $923 | +11.2% |
Median DOM | 80 days | 68 days | -15.0% |
Avg SP/LP Ratio | 95.0% | 95.8% | +0.8 pts |
SF Transactions | 37 | 70 | +89.2% |
Condo Transactions | 21 | 15 | -28.6% |
H1 Historical Context
YEAR | H1 TRANSACTIONS | H1 VOLUME | H1 MEDIAN | CONTEXT |
|---|---|---|---|---|
2019 | 99 | $155.4M | $1.31M | Pre-pandemic baseline |
2020 | 82 | $158.1M | $1.32M | Pandemic onset |
2021 | 125 | $414.4M | $2.10M | Migration surge |
2022 | 76 | $240.4M | $2.44M | Rate shock cooling |
2023 | 39 | $142.3M | $2.38M | Market trough |
2024 | 54 | $174.8M | $2.77M | Recovery begins |
2025 | 58 | $133.8M | $2.05M | Subdued; rate uncertainty |
2026 | 85 | $376.2M | $2.50M | Record volume — current |
Data & Methodology
All transaction data is sourced from historical records in the Incline Village MLS and reflects closed sales by close date within Incline Village and Crystal Bay. Single-family homes are identified as residential properties without an MLS complex designation; condominiums are identified by complex affiliation. Days on Market (DOM) reflects the listing period as reported in the MLS. Sale-to-list price ratios are calculated using the final list price at the time of contract. Historical comparisons are based on available Incline Village MLS data. This report is provided for informational purposes only and should not be considered investment, legal, or financial advice. All information is deemed reliable but should be independently verified.
Copyright
© 2026 Ming Poon Real Estate. All rights reserved. This report contains original market analysis and may not be reproduced, distributed, or published, in whole or in part, without prior written permission.
Editor's Note: This article has been updated to include context regarding a significant off-market lakefront transaction that was not reflected in the underlying MLS data but is relevant to understanding the current luxury market.