安銘
THE TAHOE TRUCKEE BRIEF
$1,380,000 | 36 | −19% |
August Median Sold Price | $2M+ Closings in August | Active Inventory vs Aug 2025 |
All-time August high | All-time single-month record | Three-year supply compression |
Hello From Tahoe
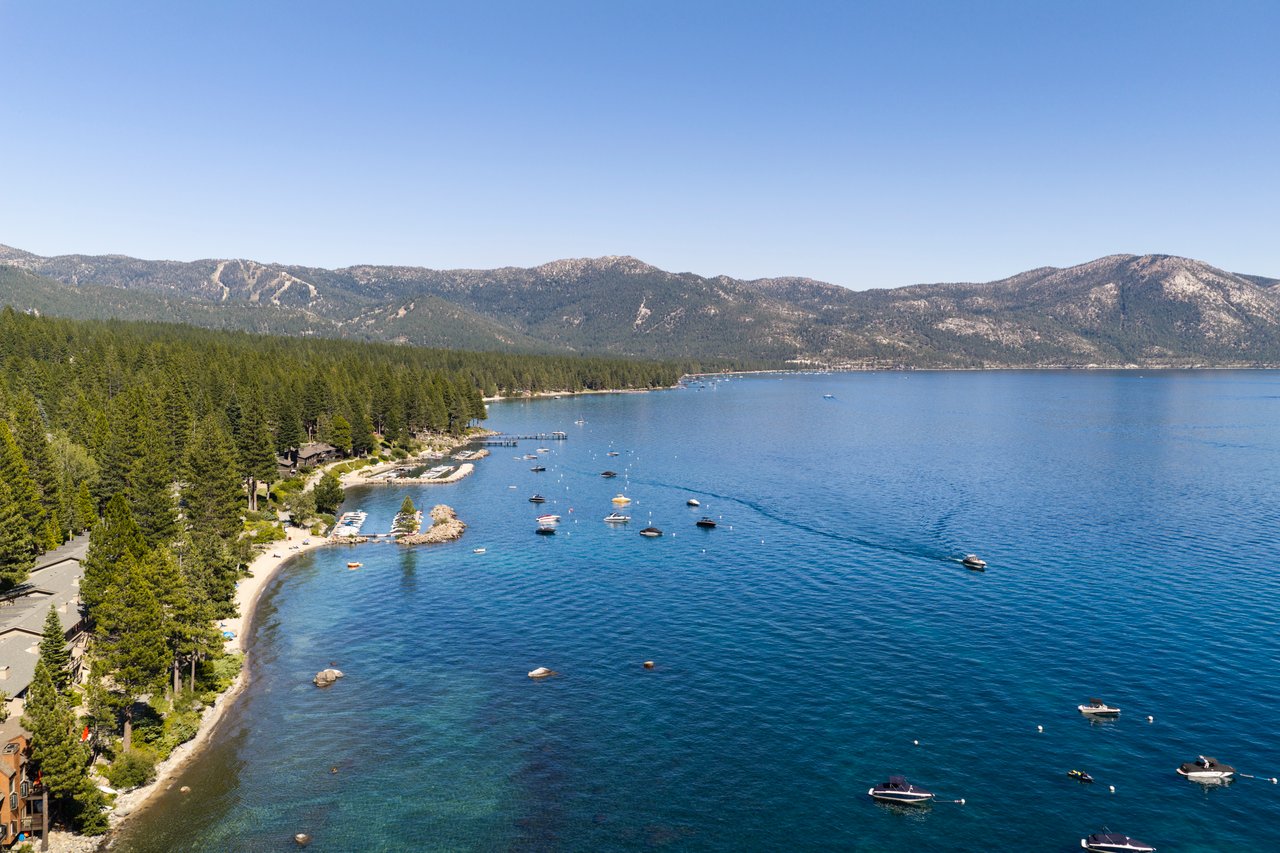
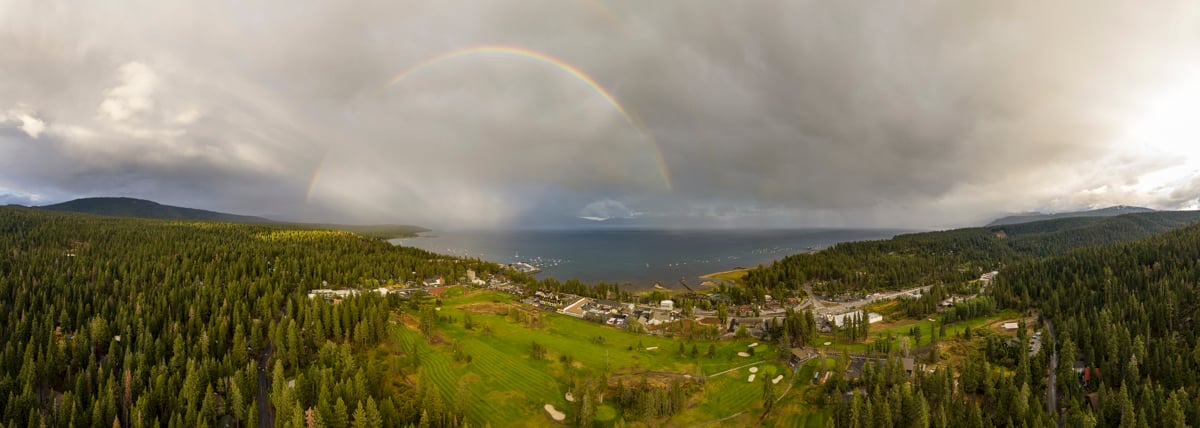
The biggest crowds of summer are behind us. The days are getting shorter, but the lake is still beautiful, golf season remains excellent, and the recent rain has brought some of the best mountain biking and trail conditions we've had all summer. There is a version of Tahoe that only the people who stay past Labor Day get to see, and this is it.
From a real estate perspective, this is one of the most useful times of year to read the market. By the end of August, we have enough seasonal data to understand how buyers have been behaving, how sellers have been responding, and where things are likely heading into fall. The summer selling season has closed its books. What it left behind is worth paying attention to.
The Supply Is Gone. The Records Followed.
That is the simplest accurate description of what happened in August 2026.
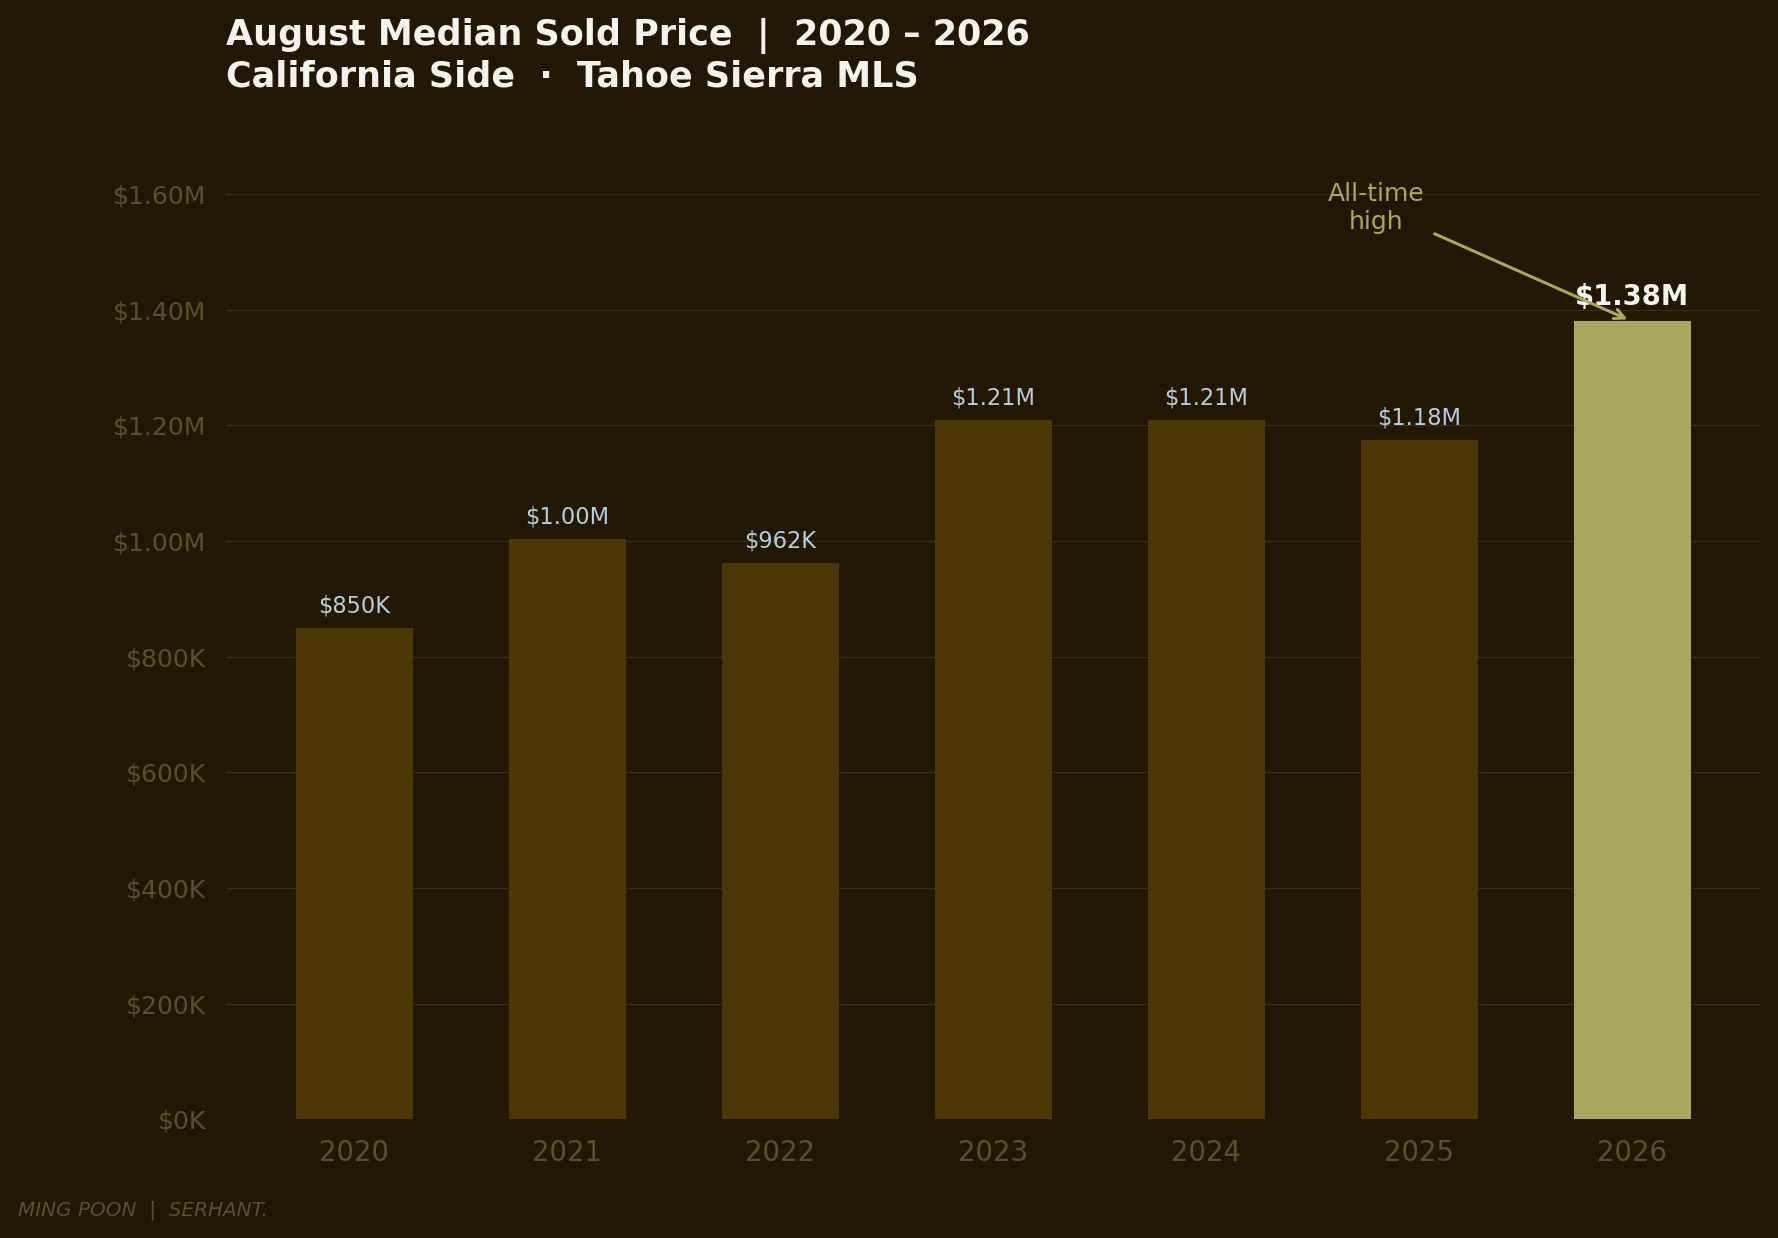
The median sold price hit $1,380,000 — the highest August median ever recorded in this market. The $2M+ segment closed 36 transactions in a single month — the highest single-month luxury count in this dataset going back to 2020. And the average selling price crossed $1,965,870, approaching $2 million for the first time in any August on record.
Two records in the same month. The explanation is not complicated. It does not require a story about surging demand or a sudden awakening of buyer confidence. The explanation is supply — or more precisely, the absence of it.
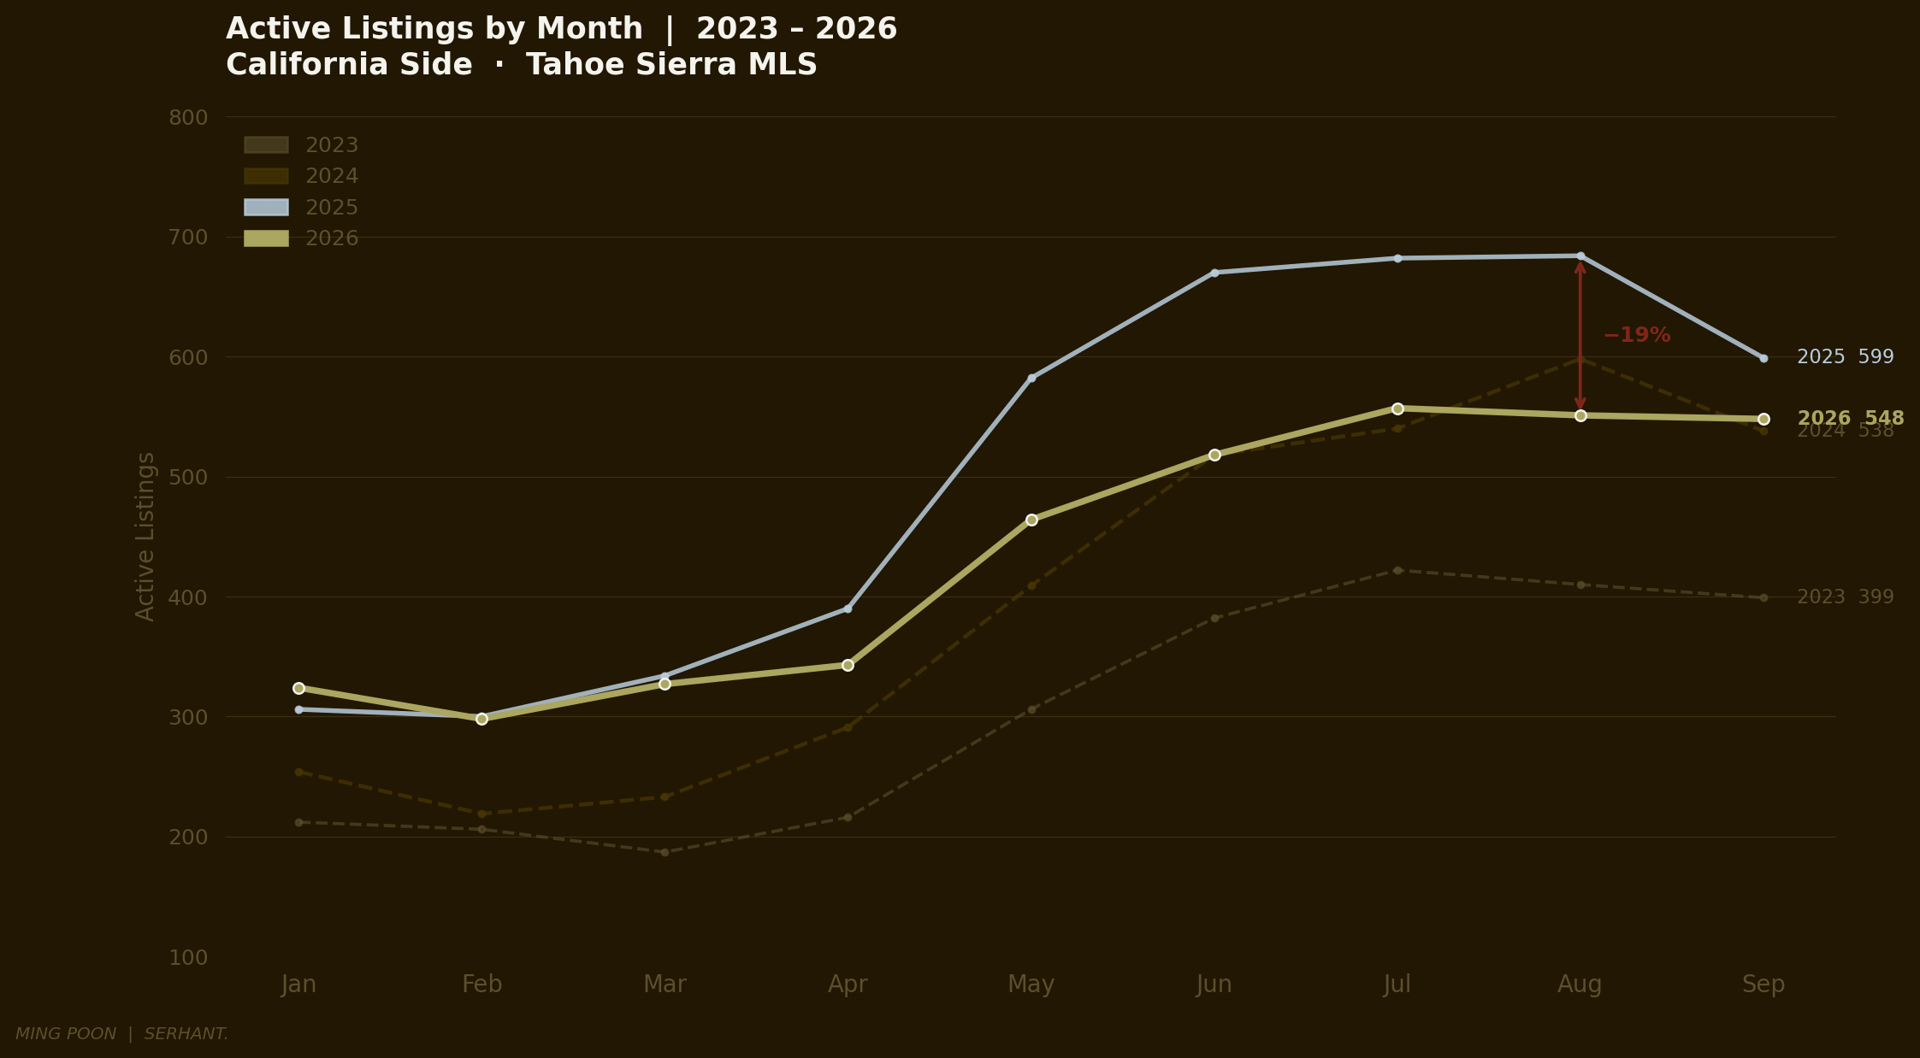
Active inventory through the summer of 2026 ran nearly 20% below 2025 levels. In June, the gap was 22.7%. In July, 18.3%. In August, 19.4%. And 2025 was already below 2024. And 2024 was already below 2023. This is a three-year compression that accelerated this summer, and what you are reading in the August sold data is its direct consequence.
When buyers have fewer choices, they pay more for the ones that exist. When properties at the $750K–$1.5M range become structurally scarce, buyers move up. When they move up, the median moves with them. The record is not momentum. It is mathematics.
I've been watching this market since 2002. What August 2026 looks like is a market that has quietly run out of supply at the price points where most buyers have historically transacted — and has not yet found a mechanism to replace it.
What August Showed Us
One hundred and eighteen closings. Volume of $236.7 million. A median of $1,380,000.
Month over month, August extended July's momentum in price while DOM expanded and luxury volume surged. July's 13.5-day median was peak-summer velocity — buyers moving fast in the heart of the season. August's 26-day median is not a reversal. It is August behaving like August always does: the school calendar pulls some buyers back, the urgency of peak summer eases, and properties that need slightly more time to find their buyer get that time. This is seasonal, not structural.
What is structural: 36 closings above $2 million. In a month. That number does not bend to seasonality. It is the highest single-month luxury count in this dataset, and it arrived in a month when overall transaction count was 118 — meaning nearly one in three closings was above $2 million. That ratio has never appeared in August before.
Year over year, the story reads as contradictory at first glance. Eighteen fewer closings than August 2025 (118 vs. 136). But volume was only modestly lower ($236.7M vs. $259.6M), the median was 17.4% higher ($1,380,000 vs. $1,175,000), and days on market improved from 37 to 26. Fewer transactions. Higher prices. Faster velocity. That combination has one explanation: the mix shifted upmarket. August 2025 had 108 sub-$2M closings. August 2026 had 82. That contraction is not buyers leaving the market. It is the inventory at those price points disappearing — and the buyers who remain transacting at higher levels because that is where the supply is.
The sale-to-list ratio held at 98.5%, up from 97.6% a year ago. The discount from original list price narrowed from 4.0% to 2.9%. Sellers are getting closer to what they asked for, faster than they were twelve months ago. That is the market telling you something.
The Supply Story

This is the narrative that the sold data alone cannot tell. The active inventory numbers tell it clearly.
In May 2025, there were 582 active listings across the Tahoe Sierra MLS. In May 2026, there were 464 — a 20% reduction. In June 2025, 670 listings. In June 2026, 518 — a 22.7% reduction. The summer selling season of 2026 opened with roughly one in five fewer listings than the prior year, and that gap held through August.
More importantly, 2026 inventory peaked earlier. In 2024 and 2025, active listings kept building through August before leveling off. In 2026, the peak was July at 557. By August it was already pulling back to 551, and September shows 548 — the market is absorbing supply faster than it is being listed. That is the definition of a tightening market, and it is happening in September, which historically is the month when supply peaks and fall selling pressure builds.
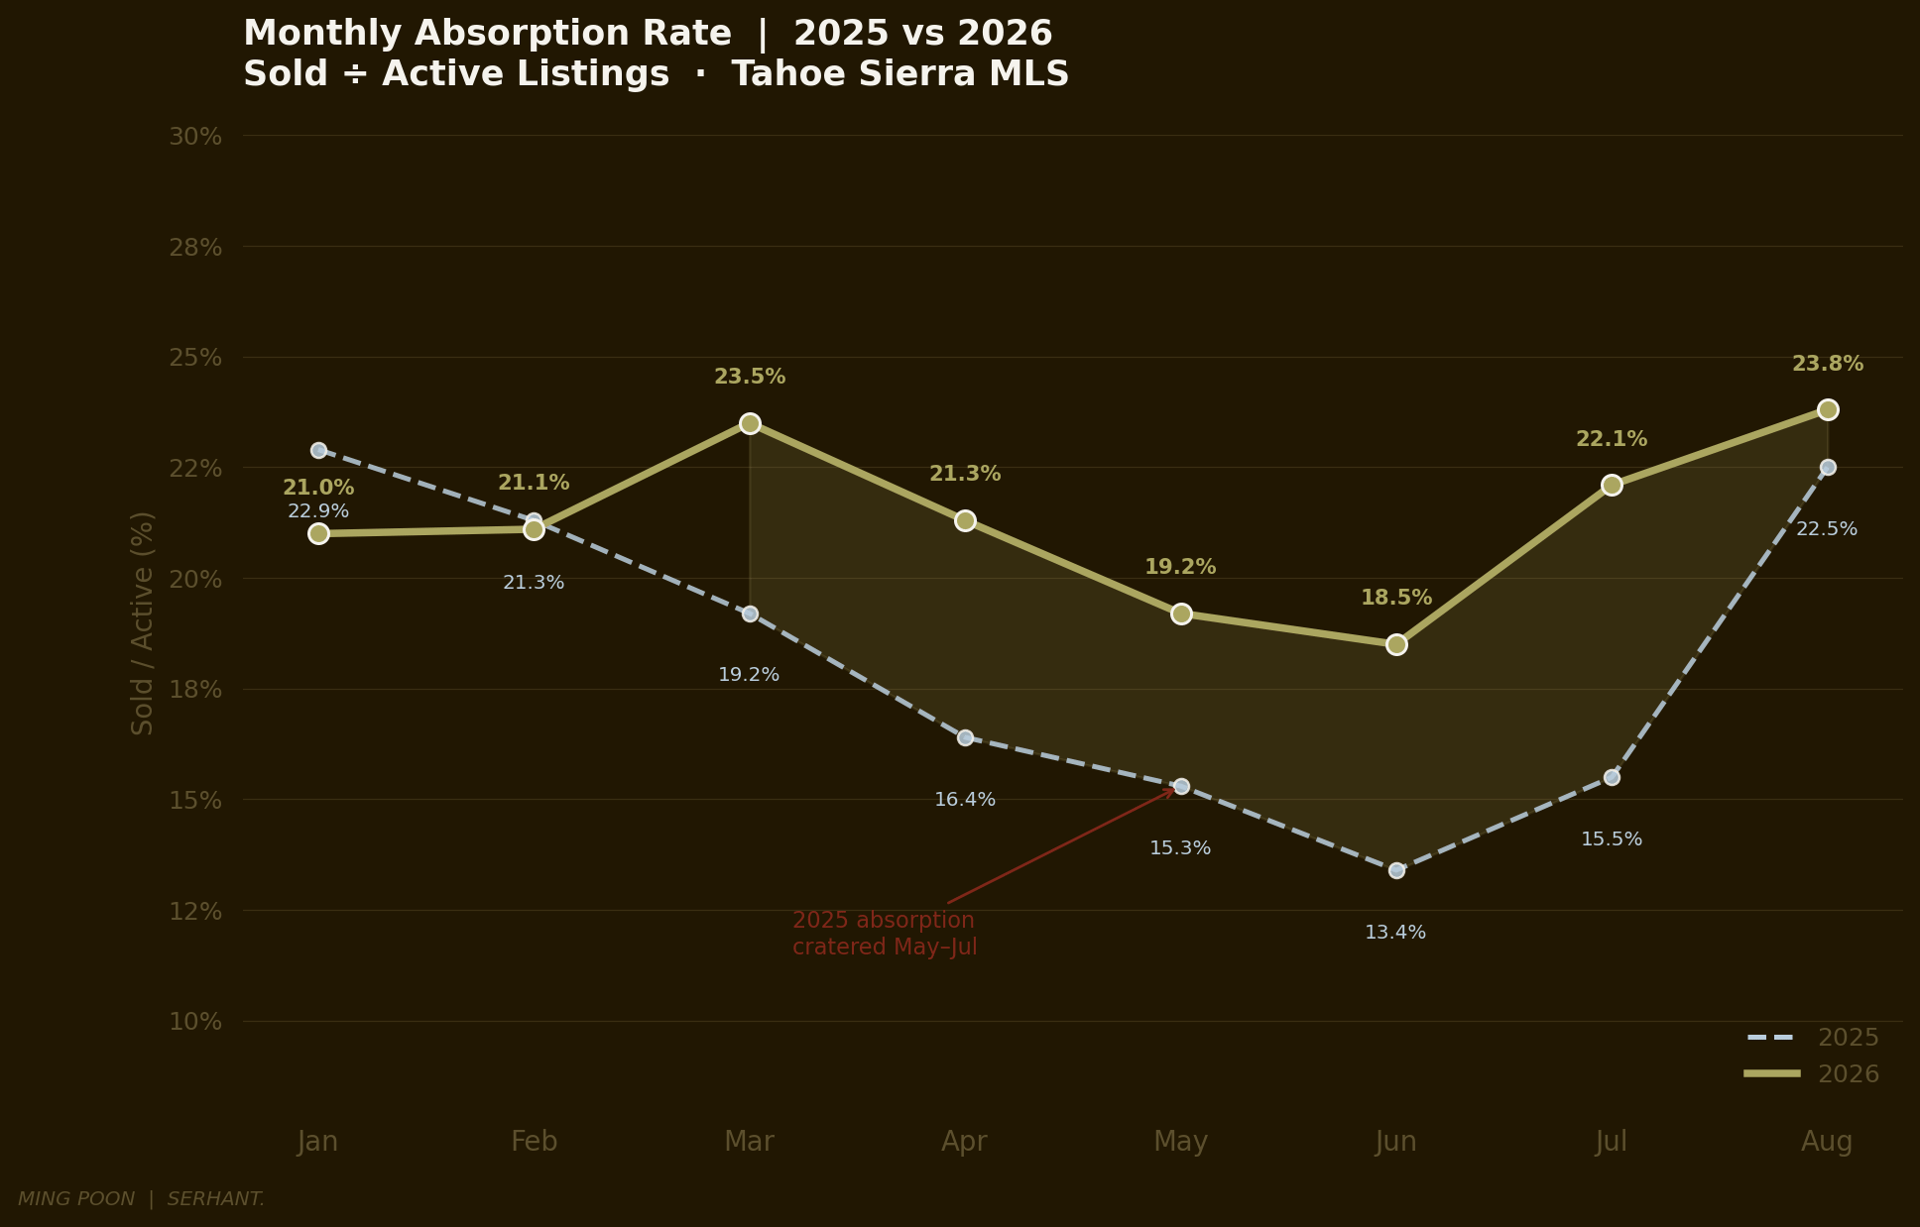
The absorption rate captures it precisely. In June 2025, 13.4% of active listings sold in the month. In June 2026, 18.5%. In July 2025, 15.5%. In July 2026, 22.1%. The market is clearing inventory roughly six percentage points faster than it was a year ago, against a backdrop of already-reduced supply. The inventory that remains is not sitting. It is moving.
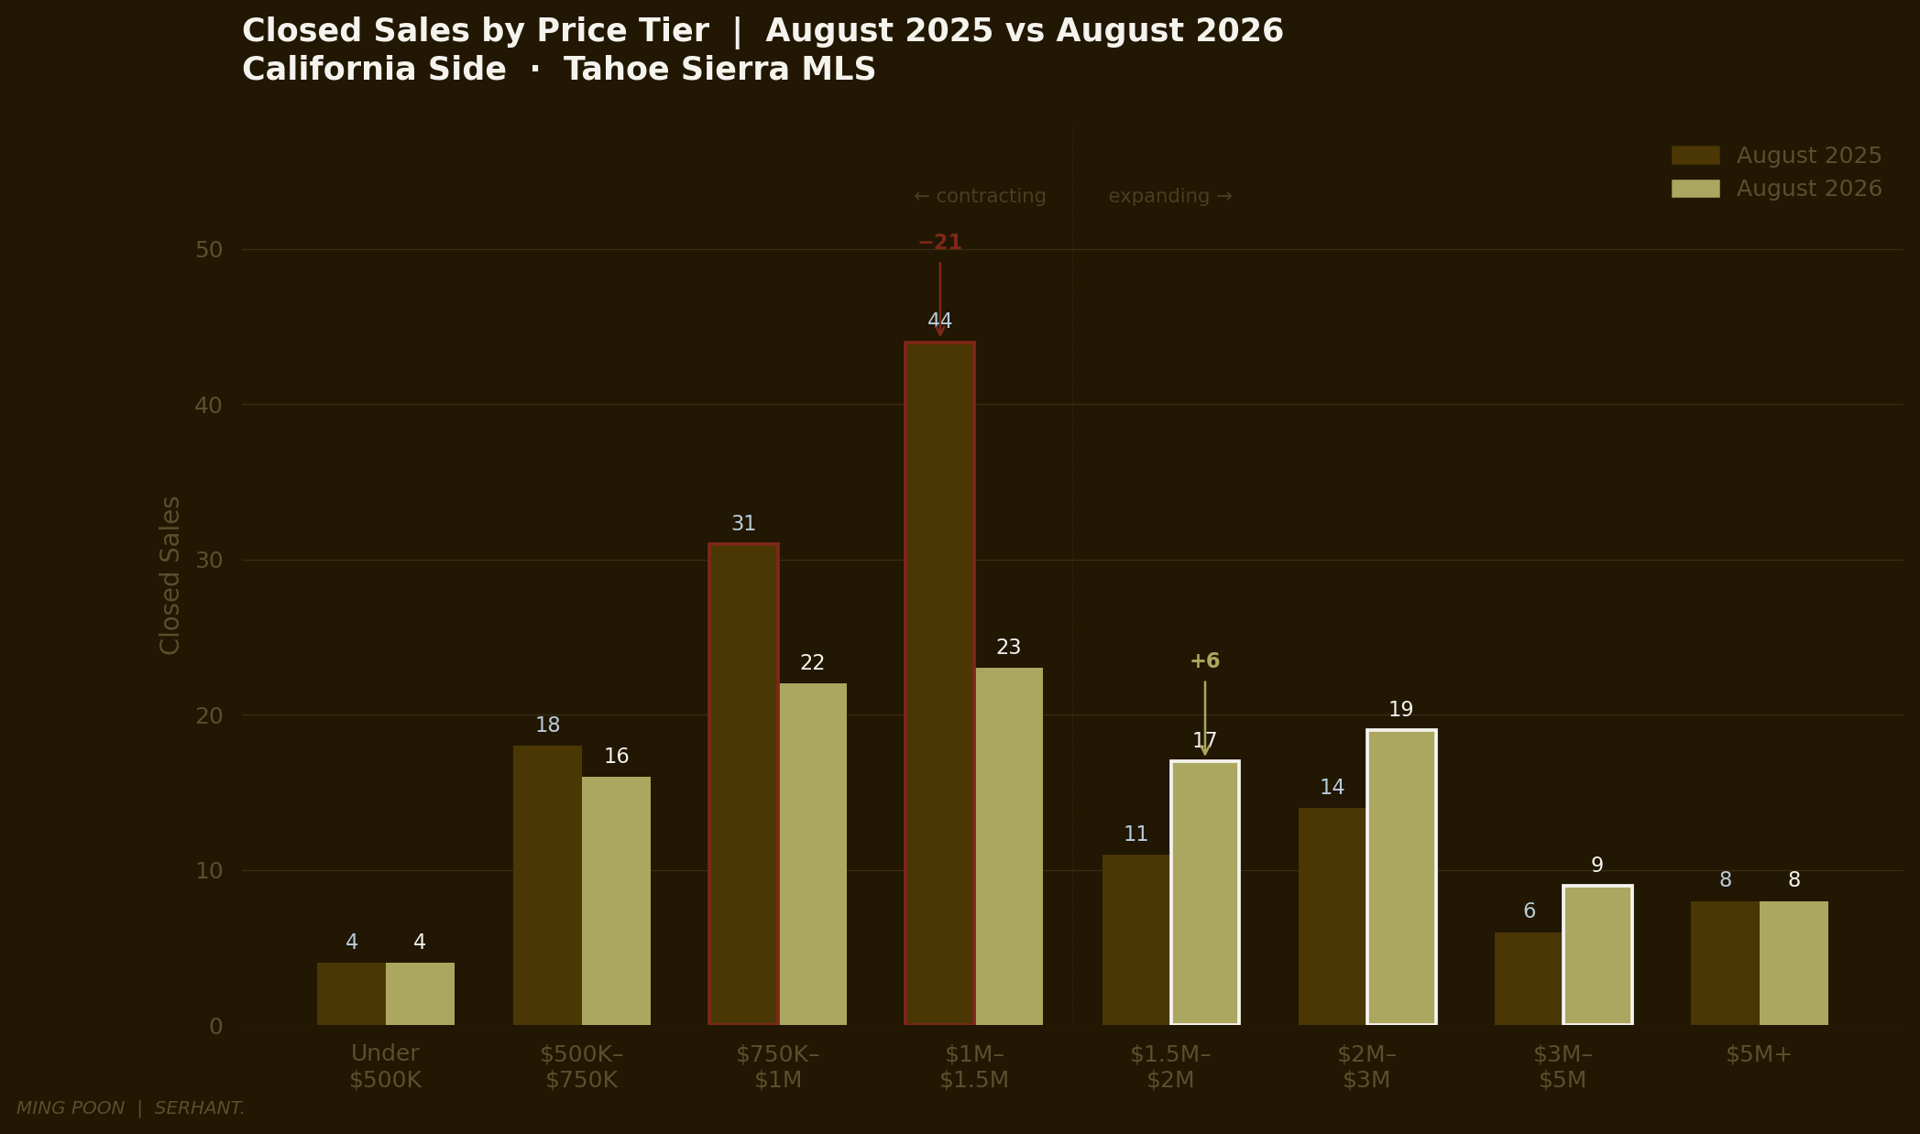
The consequence of three years of compression at the entry and mid-market is now fully visible in the sold data. The $750K–$1M tier lost nine closings year-over-year in August. The $1M–$1.5M tier lost twenty-one. Those buyers did not disappear. They moved up — to $1.5M–$2M, where closings increased by six, and to $2M–$3M, where closings increased by five. The market has physically moved upmarket because the lower tiers no longer have the inventory to support the volume they once generated.
There is no current mechanism to reverse this. Land is constrained. Permitting timelines are long. Construction costs remain elevated. The properties that transacted at $800K five years ago are now priced at $1.2M, and the next owner is unlikely to sell below what they paid. The supply compression is structural, not cyclical. That matters enormously for how buyers and sellers should think about the next twelve to twenty-four months.
The Price Tier Shift
The most useful way to see what is happening to this market's composition is to look at where August 2025 and August 2026 diverge.
Price Tier | August 2025 | August 2026 | Change |
|---|---|---|---|
Under $500K | 4 | 4 | — |
Price Tier | August 2025 | August 2026 | Change |
|---|---|---|---|
$500K–$750K | 18 | 16 | -2 |
$750K–$1M | 31 | 22 | -9 |
$1M–$1.5M | 44 | 23 | -21 |
$1.5M–$2M | 11 | 17 | +6 |
$2M–$3M | 14 | 19 | +5 |
$3M–$5M | 6 | 9 | +3 |
$5M+ | 8 | 8 | — |
The contraction from $750K to $1.5M — down 30 closings year-over-year — and the expansion above $1.5M — up 14 closings — tells you everything about where the market went in August. The buyers are present. The sub-$1.5M inventory is not.
The Luxury Layer
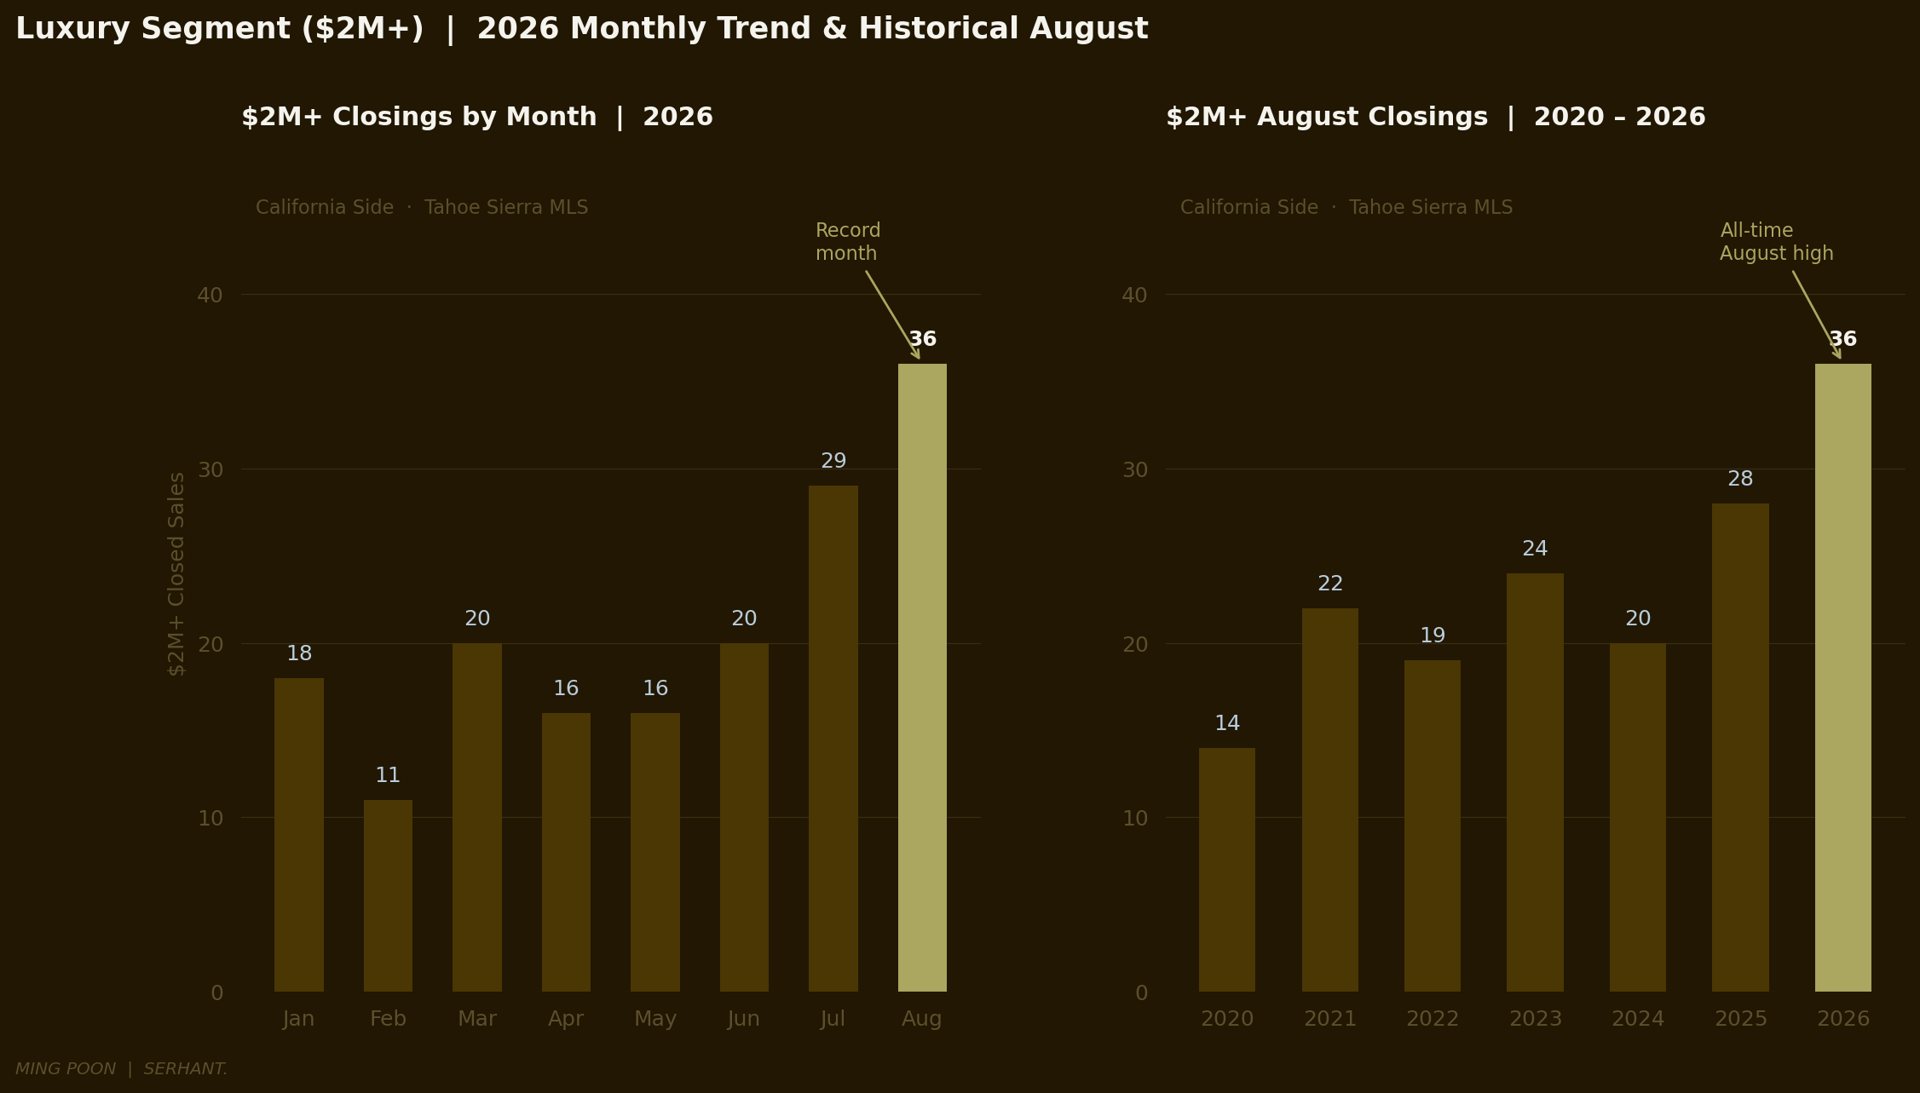
Thirty-six closings above $2 million in August 2026. In any prior August, the high-water mark was 28 — which happened in August 2025. This month surpassed it by 29%.
The $2M+ segment's share of total August sales rose from 20.6% last year to 30.5% this year. Nearly a third of all closings were above $2 million. That is a structural shift in market composition that would have seemed implausible in 2023, when the luxury segment was absorbing a rate shock and sitting on 60-plus-day DOM across the board.
The segment is now moving with conviction. Average DOM for $2M+ closings in August was 61 days — down from 57 in August 2025, but within the same range. Compare that to Q1 of this year, when the $2M+ segment was averaging 84 days. The compression over eight months has been real and consistent.
The headline luxury transactions of August:
8747 Lakeside Drive, Rubicon Bay — $13,500,000. 4,492 square feet of Lake Tahoe lakefront in the deep South Shore. Fifty-nine days on market, 7.7% below ask, 11.2% below original list. The Rubicon Bay buyer takes their time. When they move, they move at scale — this was the largest single transaction of the month.
9500 Dunsmuir Way, Truckee (Martis Camp) — $11,995,000. 6,441 square feet, 15 days on market, at ask. No lake. No discount. Fifteen days. The largest non-lakefront mountain closing of 2026 makes the case, again, that Martis Camp is operating as its own market — premium-priced, low-supply, and highly sought by the full-time relocation buyer.
Two zero-DOM Truckee closings above $6.8M. 2500 Chatwold Court at $7,741,260 and 10506 Kaweah Court at $6,850,000 both closed with zero days on market. Pre-market transactions at this price level in the mountain community tell you the buyer pool is organized, connected, and not waiting for a listing to hit the MLS.
250 Grimsel Pass Road, Homewood — $4,000,000. Asked $3,650,000. Closed at $4,000,000. Eleven days on market. That is a 9.6% over-ask close on a $4 million non-lakefront West Shore property in August. The West Shore premium is not theoretical. It is documented.
The Lakefront Layer
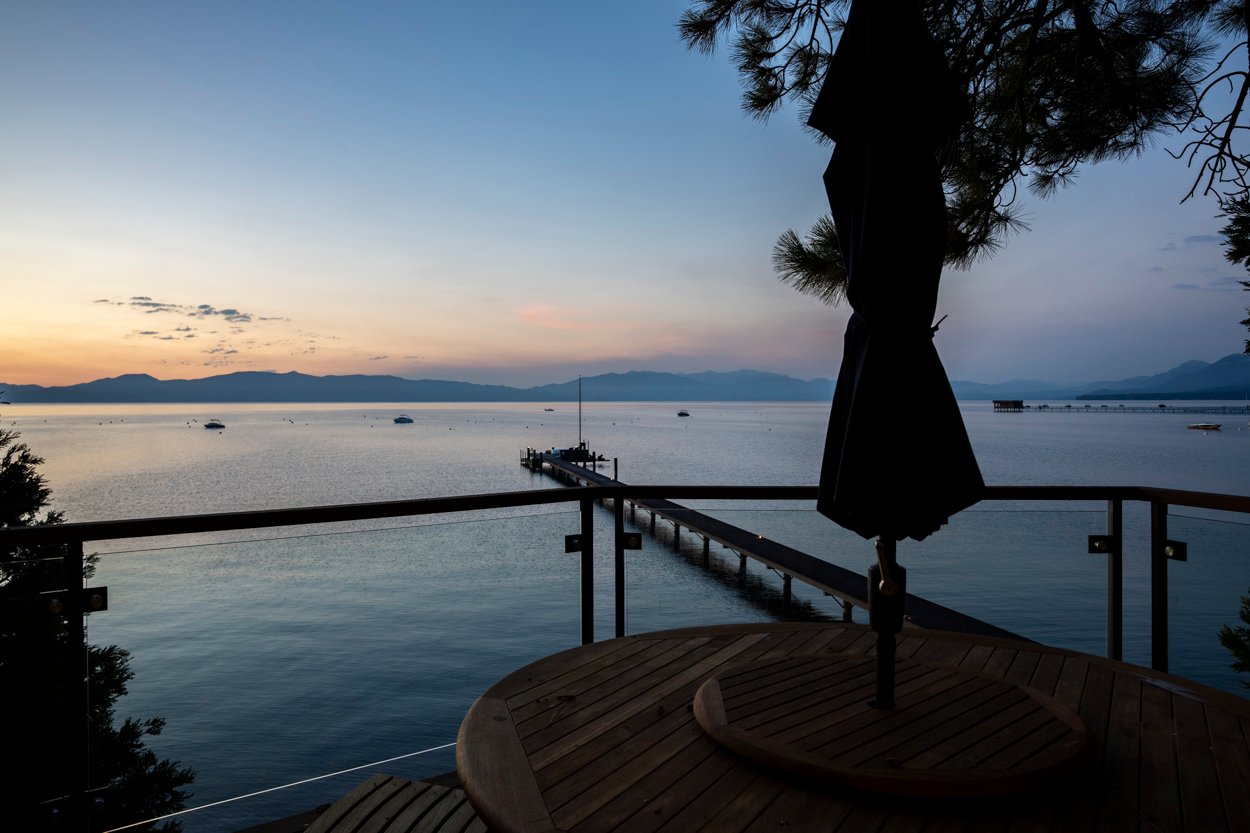
Six Lake Tahoe and Donner Lake lakefront closings in August. The range: $1,050,000 to $13,500,000.
The Rubicon Bay story dominates the month. Two closings on Lakeside Drive — 8747 at $13,500,000 and 8781 at $7,024,000 — totaling $20.5 million from a single street in a single month. Rubicon Bay rarely appears in the monthly data; when it does, it tends to appear with weight. Both properties took 40–59 days to close, both required discounts from original ask, and both represent the kind of patient trophy transaction that the deep South Shore produces. The buyer pool for Rubicon Bay is narrow. The properties are irreplaceable. The transactions happen on their own timeline.
9200 Brockway Springs Drive in Kings Beach closed at $1,750,000 — $50,000 above asking — in 13 days. That property has appeared in this dataset multiple times across 2026, each time at a different price point in the Brockway Springs complex. It remains the most active single-address lakefront corridor in the CA-side data.
The Donner Lake closing — 15066 South Shore Drive in Truckee at $2,900,000 in 10 days — is the fastest Donner Lake lakefront close of the year. Priced at $3,295,000, it moved in under two weeks at a modest 11.9% discount from ask. The Donner Lake buyer is present and deliberate.
YTD lakefront context: 29 closings through August on the CA side. Total volume: $162.9 million. Seven closings above $10 million. Median sold price: $3,300,000. The pace and scale of the 2026 lakefront market is the strongest since 2021 by total dollar volume, and the trophy segment — properties above $10M — has been more active than any prior year in this dataset.
Truckee Continues to Carry the Market

Sixty-seven of 118 August closings were in Truckee. Fifty-seven percent of all transactions. $139.4 million of $236.7 million total volume — 59 cents of every dollar closed in August came from Truckee.
That concentration has been building all year. Truckee's dominance is not just volume-driven; it is quality-driven. The five largest non-lakefront sales of 2026 YTD are all Truckee addresses. The pre-market closings are in Truckee. The Martis Camp corridor — Dunsmuir Way, Chatwold Court, Valhalla Drive, Kaweah Court — is generating transaction sizes that would have defined the lakefront market a decade ago.
What Truckee offers that no other submarket in this dataset matches: master-planned community environments with controlled supply, year-round amenity infrastructure, and a buyer profile increasingly oriented toward full-time or primary residence rather than seasonal use. The Martis Camp buyer is not choosing between Truckee and Lake Tahoe. They have already decided. They are choosing between being on the market and being off it, and the zero-DOM closings tell you how that decision is going.
Homewood produced the most interesting non-Truckee transaction of August — 250 Grimsel Pass Road at $4,000,000, +9.6% above ask, 11 days on market. The West Shore remains the most emotionally compelling address in this market for a certain kind of buyer — one who values the specific orientation, the light, the setting — and when the right property appears at the right price, that buyer has already been waiting.
Where the Market Has Been: August in Historical Context
Year | August Sales | Median Price | Avg DOM | Avg $/Unit |
|---|---|---|---|---|
2020 | 304 | $850,000 | 14 | $1,398,618 |
2021 | 189 | $1,003,555 | 11 | $1,571,513 |
2022 | 136 | $962,500 | 19 | $1,295,081 |
2023 | 160 | $1,209,000 | 13 | $1,611,706 |
2024 | 135 | $1,210,000 | 30 | $1,733,428 |
2025 | 154 | $1,175,000 | 37 | $1,865,110 |
2026 | 118 | $1,380,000 | 26 | $1,965,870 |
The average selling price of $1,965,870 in August 2026 is the highest in any August in this dataset — surpassing 2025's $1,865,110 and the 2022 peak of $1,295,081 by more than 50%. The average is relevant here because it captures the weight of the luxury transactions. Thirty-six closings above $2M in a pool of 118 pulls the mean well above the median, and that gap — $1.38M median against a $1.97M average — is itself a data point. The luxury segment is contributing a disproportionate share of dollar volume. That is not a distortion. It is composition accurately described.
Transaction count of 118 is the lowest August in recent memory outside of 2022's rate-shock contraction. But volume per transaction has never been higher. This is a market doing more with less — fewer properties at accessible price points, larger average transactions, stronger aggregate pricing.
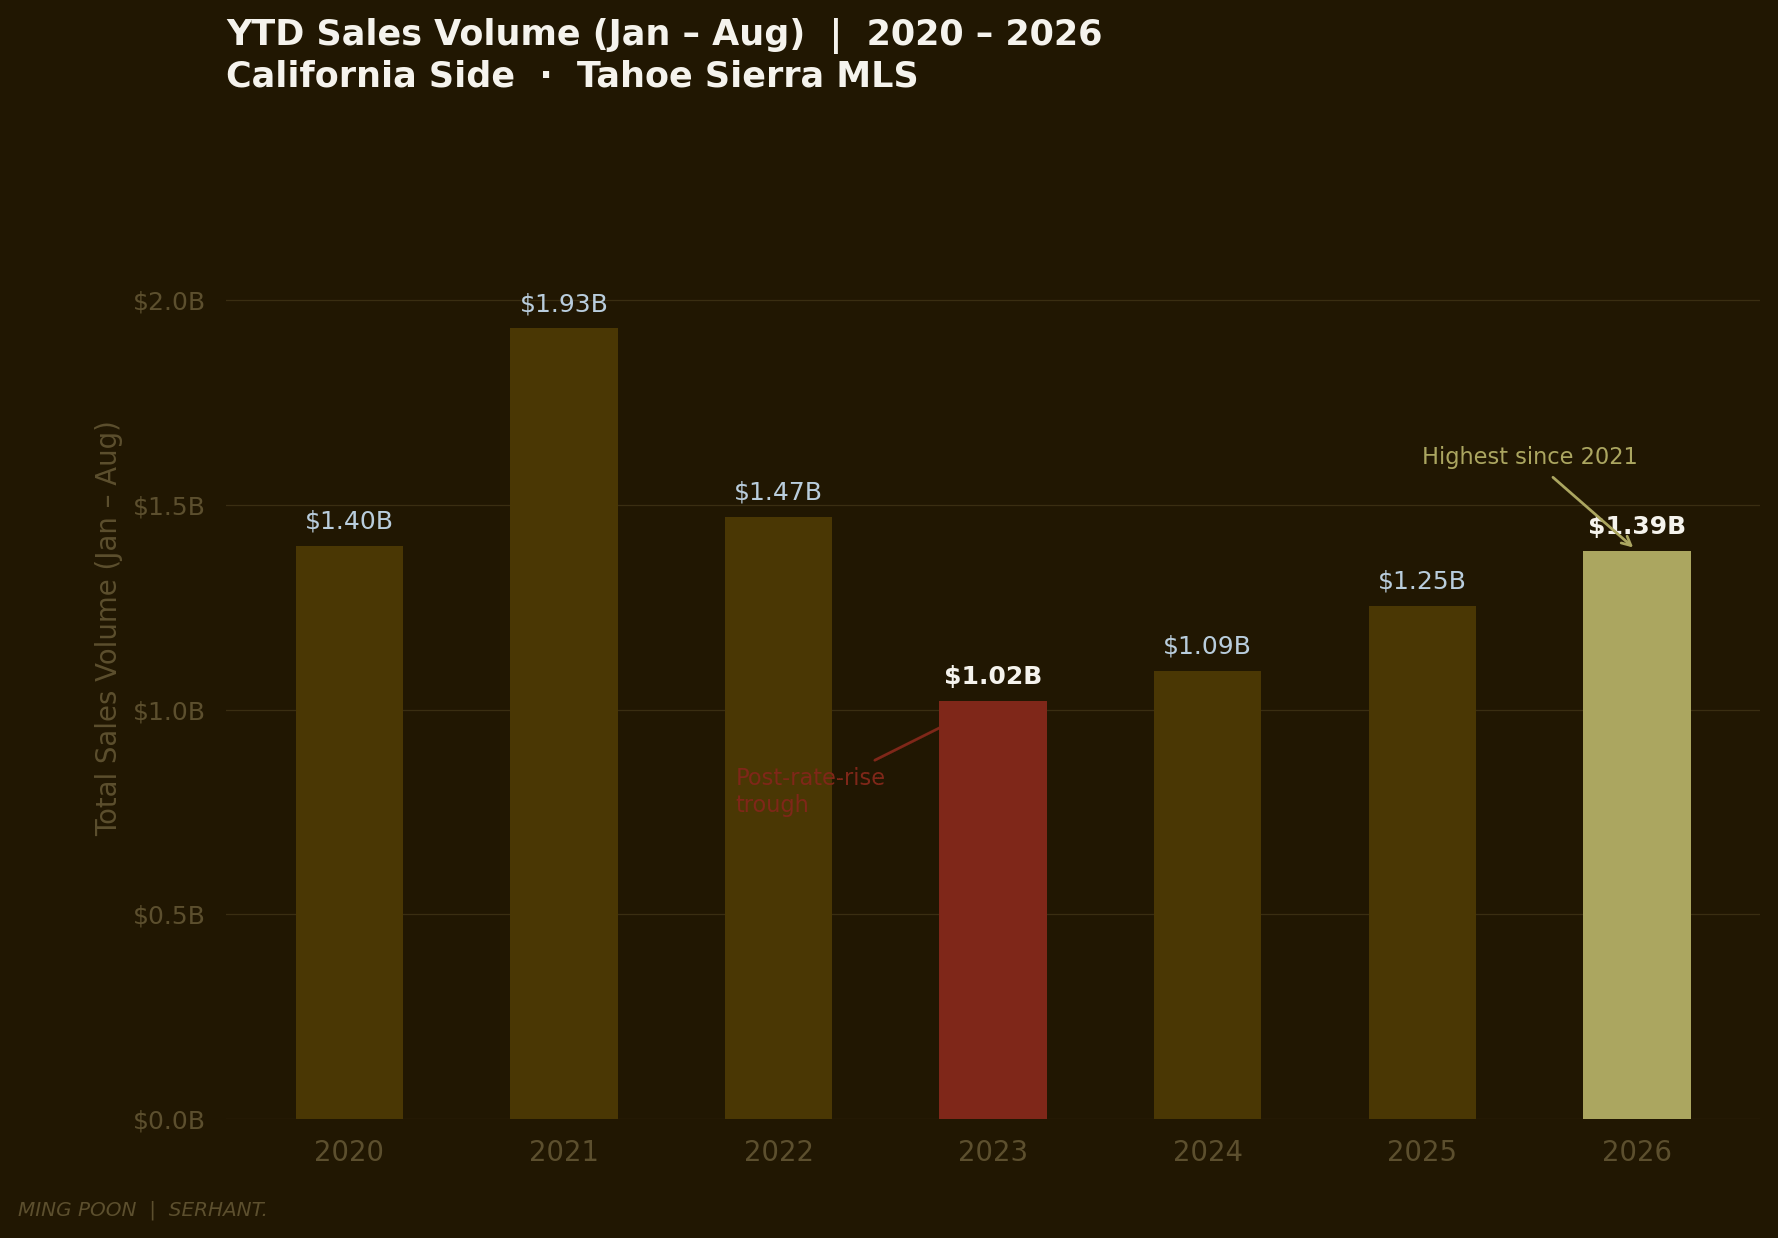
The year-to-date volume through August 2026 is $1.388 billion — the highest since 2021 and 10.8% above the same period in 2025. Three consecutive years of recovery from the 2023 trough, each year building on the last.
Where It's Going: Professional Opinion
The supply compression story does not resolve quickly. There is no inventory wave coming. The properties that would have listed at $900K three years ago now carry $1.3M price tags, and the owners who bought at those levels have no compelling reason to sell into a market where their replacement costs the same or more. The cycle that feeds entry-level supply — owner outgrows, sells, moves up — has stalled at both ends.
What I expect in the second half of 2026: the sub-$2M market continues to tighten. DOM in that segment will not return to the 30–40 day averages that characterized 2024 and early 2025. Prices in the $1M–$1.5M range will firm through fall because there is not enough inventory to satisfy the buyers who are looking there.
The $2M+ segment has completed its transition from buyer's market to balanced — and the August data makes a credible case that it has crossed into seller's market territory, at least temporarily. The months-of-supply calculation from the current active inventory file (approximately 3.3 months at August's pace) puts the luxury segment below the conventional 4–6 month balanced threshold. One more month of data at this pace confirms it. If it confirms, the conversation with luxury sellers changes materially.
Rubicon Bay will not produce two closings every month. Martis Camp will not produce two zero-DOM $7M+ closes every month. The trophy end of the market is episodic by nature. But the August data is evidence that the capital is present and the buyer pool in the upper segment is more active than it has been since the frenzy years. That is not a prediction. It is a documented observation.
Fall will test the supply thesis in real time. If September and October active inventory stays compressed — trending below 2025 levels as it has all year — and absorption holds in the 18–24% range, the market enters winter with less overhang than any recent year. That sets up Q1 2027 differently than Q1 2026, which was characterized by the slowest velocity and widest DOM spreads in the 2026 data.
If you are a buyer in the sub-$2M range: the inventory math is not in your favor and it is not improving. The sub-$1.5M tier lost thirty closings year-over-year in August not because demand dropped but because supply disappeared. What is available is moving in under two weeks. The buyer who is still waiting for the market to come to them has been waiting through the lowest-supply summer in three years. That strategy has a cost.
If you are a seller priced below $2M: your leverage is higher than it has been at any point since 2022. Absorption is running 6–7 percentage points above last year in the core summer months. If you are priced right, you should expect activity within two weeks. If you have been sitting without activity, the price is the answer.
If you own property above $2M: the market that was clearly buyer-favored in Q1 is no longer clearly anything. The $2M+ segment closed a record 36 transactions in August. Months of supply is approaching 3 months. If you have been waiting for a better market, you may be inside it. The next two months of data will tell us whether August was the turning point or a spike. Either way, the window for complacent pricing in the luxury segment has narrowed.
If you own lakefront: the trophy market is functioning. Seven closings above $10M YTD on the CA side, $162.9M in total lakefront volume through August — the capital is here, it is active, and the buyer pool that can transact at that level is not rate-sensitive. If your property is prepared and priced with honesty, this fall represents a real selling season, not a holding pattern.
The Closing

There is a moment in late August — after the summer crowds have thinned, before the aspens turn — when the lake belongs to the people who actually live here. The parking lots are manageable. The trails are quiet by 9am. The water is still warm enough to swim and the light has started doing something different, something longer and more amber than July ever managed.
It's the best month to be here. It's also the month that clarifies something about who stays and who doesn't, who made the decision and who is still making it.
The data says the people who made the decision — who bought here, who committed to this place — are sitting on a market that has moved steadily and significantly in their favor for three years. The people still deciding are facing a market that has fewer choices and higher prices than it did a year ago, a year before that, or a year before that.
I don't say that to create urgency. I say it because it's what the numbers show. And the conversation I want to have is the one where we look at what these numbers mean for your specific situation — not the aggregate, not the headline, but your property, your timeline, your life.
That conversation starts whenever you're ready.
All data sourced from the Tahoe Sierra MLS, California side. Nevada-side communities and South Lake Tahoe excluded. Lakefront classification uses MLS Setting field per standing methodology: Lake Tahoe and Donner Lake only; Split Lakefront, Soda Springs, and Donner Lake sub-$700K fractional properties excluded. Active inventory figures sourced from Tahoe Sierra MLS summary data covering broader MLS geography; used for directional trend analysis. Sold data covers closed transactions through August 31, 2026. Historical data spans 2020–2026. Figures subject to revision as late-reported sales are recorded.