INCLINE VILLAGE & CRYSTAL BAY · AUGUST 2026
August 2026
Market Update
Data through July 31, 2026 · by Ming Poon
YOUR TAHOE-TRUCKEE MARKET INTELLIGENCE
* YoY comparisons: July 2025 included a $24.5M outlier — see analysis below.
ANALYSIS — JULY 2026
Read the Internals, Not Just the Headline
July's numbers look softer on the surface: 12 closings, $42.4 million, a median price that fell below the spring peaks. But the internals tell a sharply different story — and they're worth reading carefully before drawing conclusions.
Start with what the data actually shows. The 97.5% average sale-to-list ratio is the highest of any month in the 2026 calendar year, including May's 97.2%, which was previously the peak. Three of 12 July closings transacted at or above list price. The median days on market of 34 is the lowest single-month reading in the dataset. This is not a soft market. This is a market where the transactions that are happening are happening fast and at strong prices — the volume decline is a supply story, not a demand story.
What July actually lacks is mid-market supply. The $2.5M–$4M price band — which generated 7 closings in June and 6 in May — produced zero closings in July. Not zero buyers: the contingent pipeline includes five properties in the $2.5M–$5M range currently under contract. The sellers simply aren't there yet, and the inventory that has come to market skews either toward entry-level or toward the top of the luxury spectrum, leaving the move-up tier temporarily starved of product.
"The July sale-to-list ratio of 97.5% is the highest monthly reading of 2026. The median DOM of 34 days is the lowest of the year. These are not the internals of a slowing market — they are the internals of a supply-constrained one."
The year-over-year comparison is similarly deceptive. July 2025's $58.4M in volume included a $24.5M outlier transaction that single-handedly distorted that month's average and median figures. Strip that out and July 2025 produced $33.9M across 12 transactions at a median of $1.9M — meaningfully below July 2026's $42.4M across the same 12 transactions at a $2.175M median. Framed correctly, July 2026 is actually an improvement over the comparable prior-year period.
The three July closings that came in at or above asking price are worth naming: 539 Cole Circle at $9.25M (100% of ask, 27 DOM), 932 Lakeshore Boulevard at $7.85M (101.3% of ask, 25 DOM), and 344 Country Club Drive at $2.4M (102.1% of ask, 13 DOM). Three different price tiers, three different neighborhoods, same result: motivated sellers, confident buyers, and no negotiating room.
MONTHLY PERFORMANCE
Transactions & Volume: 2025 vs. 2026
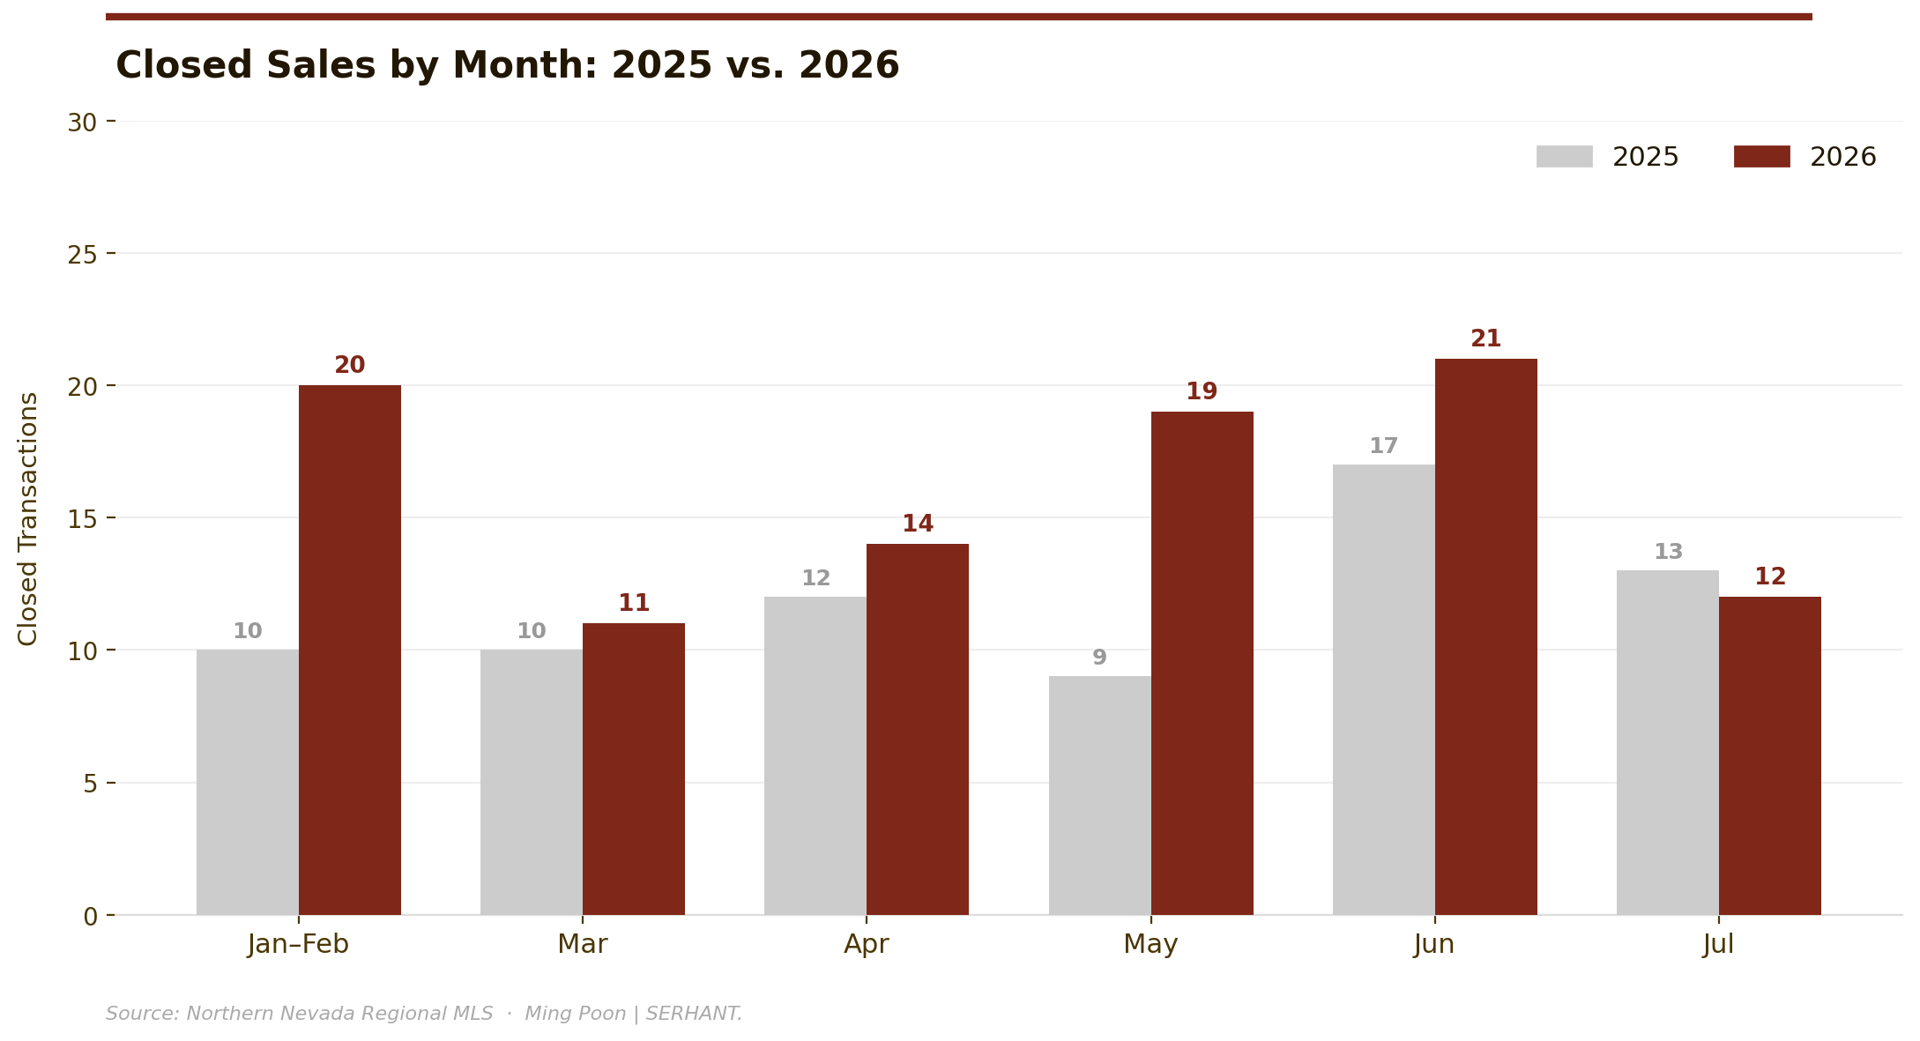
Monthly closed transactions, 2025 vs. 2026.
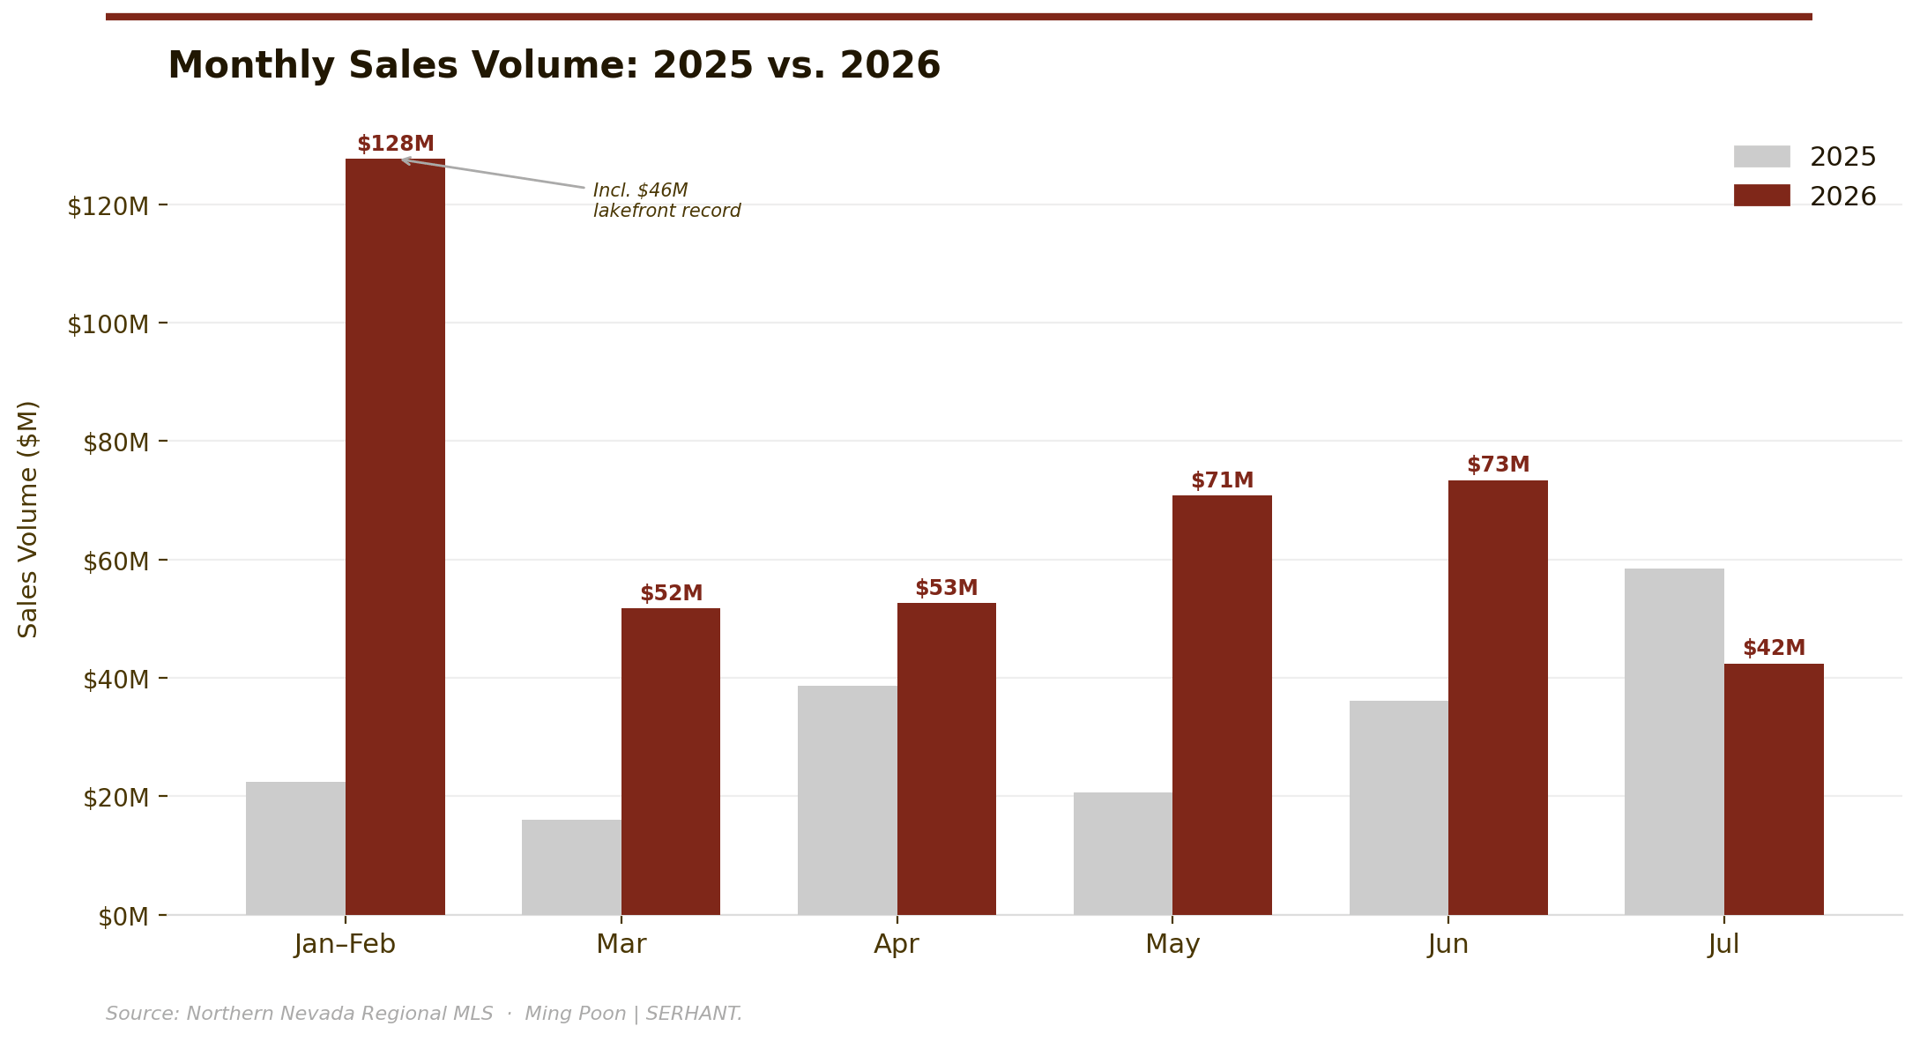
Monthly sales volume in $M, 2025 vs. 2026. Jan–Feb includes the $46M lakefront record.
March
11 closings, $51.7M in volume, at a $2.76M median — the highest monthly median of the year — but a 146-day median DOM, the backlog peak for 2026, as fall 2025 listings finally cleared.
April
14 closings, $52.5M in volume. Median DOM compressed sharply to 70 days and the sale-to-list ratio rose to 95.3%, as the market found its spring rhythm.
May
19 closings, $70.8M in volume — the strongest month of H1 by dollar volume — with DOM falling to 45 days and SP/LP climbing to 97.2%, then the year's high.
June
21 closings, the highest monthly count of the year, and $73.4M in volume. DOM ticked up slightly to 51 days; SP/LP held strong at 96.7%.
July
12 closings, $42.4M in volume — a seasonal moderation from the spring peak, but with the year's best internals: 34-day median DOM and a 97.5% sale-to-list ratio.

PRICING & MARKET VELOCITY
Price, Pace & Negotiating Power
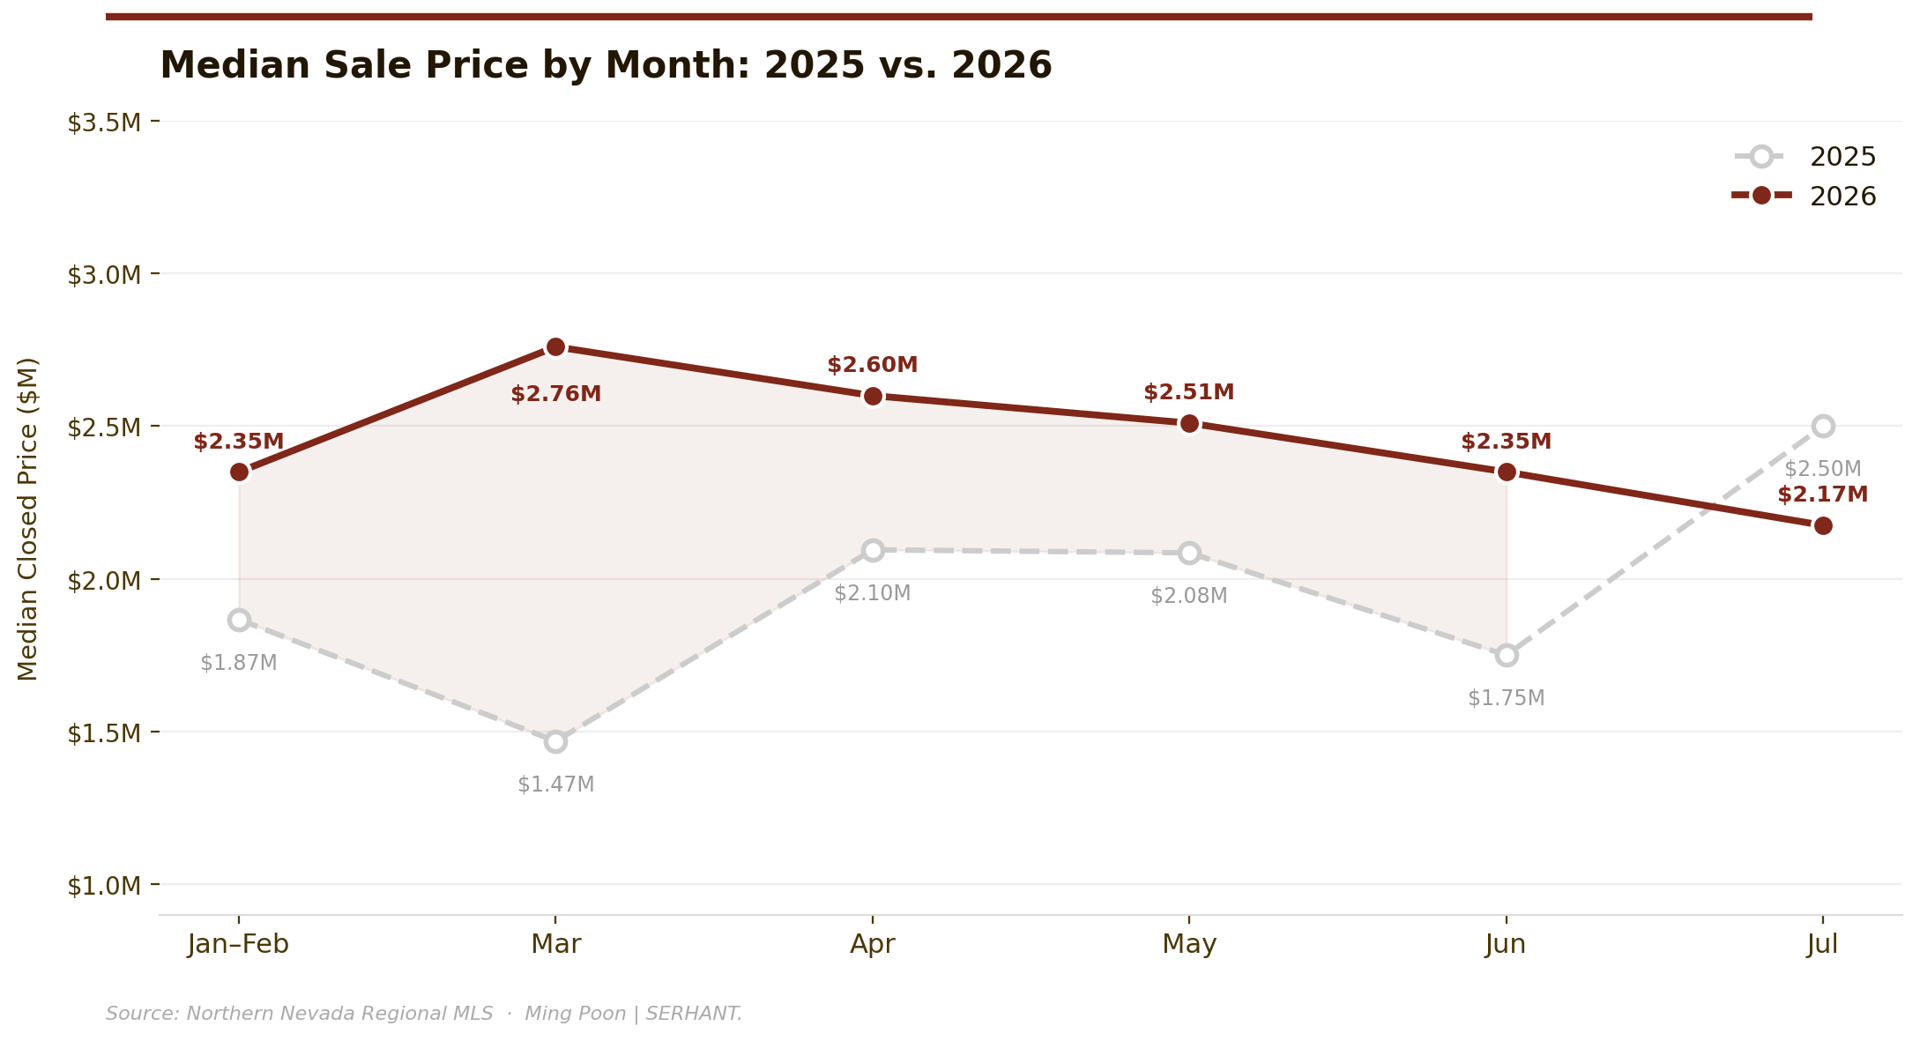
Median sale price by month, 2025 vs. 2026. The 2026 line holds consistently above 2025 across all six months.
March 2026's $2.76 million median was the high-water mark of the year — a reflection of backlog inventory finally clearing at prices sellers had held firm on through the winter. July's dip to $2.175 million is not a price decline; it is a product-mix story. The month's 12 closings simply skewed lighter, with the $2.5M–$4M tier producing zero transactions.
Every 2026 month has cleared meaningfully above its 2025 counterpart, and the spread has held even as monthly volume has moderated into summer — evidence that the repricing of this market is broad-based rather than driven by a handful of outlier sales.
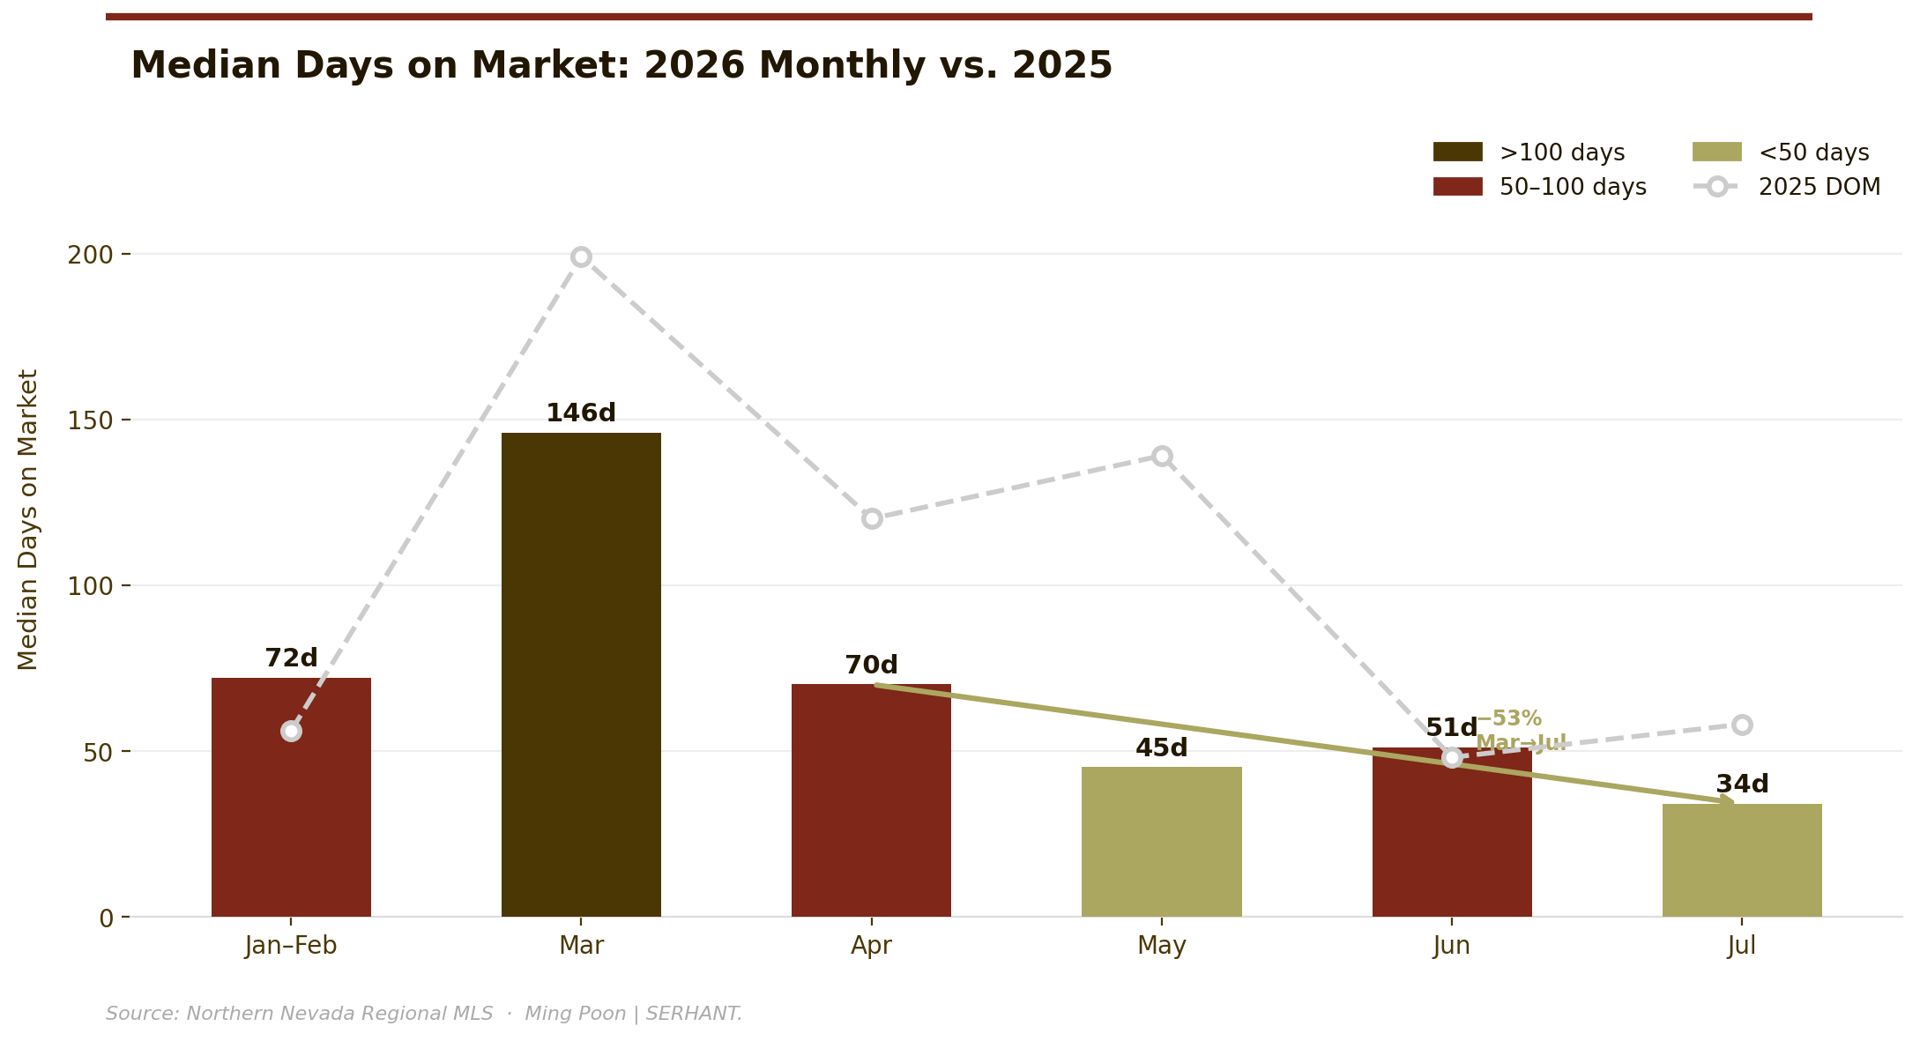
Median days on market by month, 2026 (bars) vs. 2025 (dashed). March's 146-day reading reflects backlog clearing. July's 34 days is the lowest reading of the year.
"DOM has fallen every month since March's 146-day peak. July's 34-day median is the lowest reading in the 2026 dataset — and arguably the most bullish signal in this report."
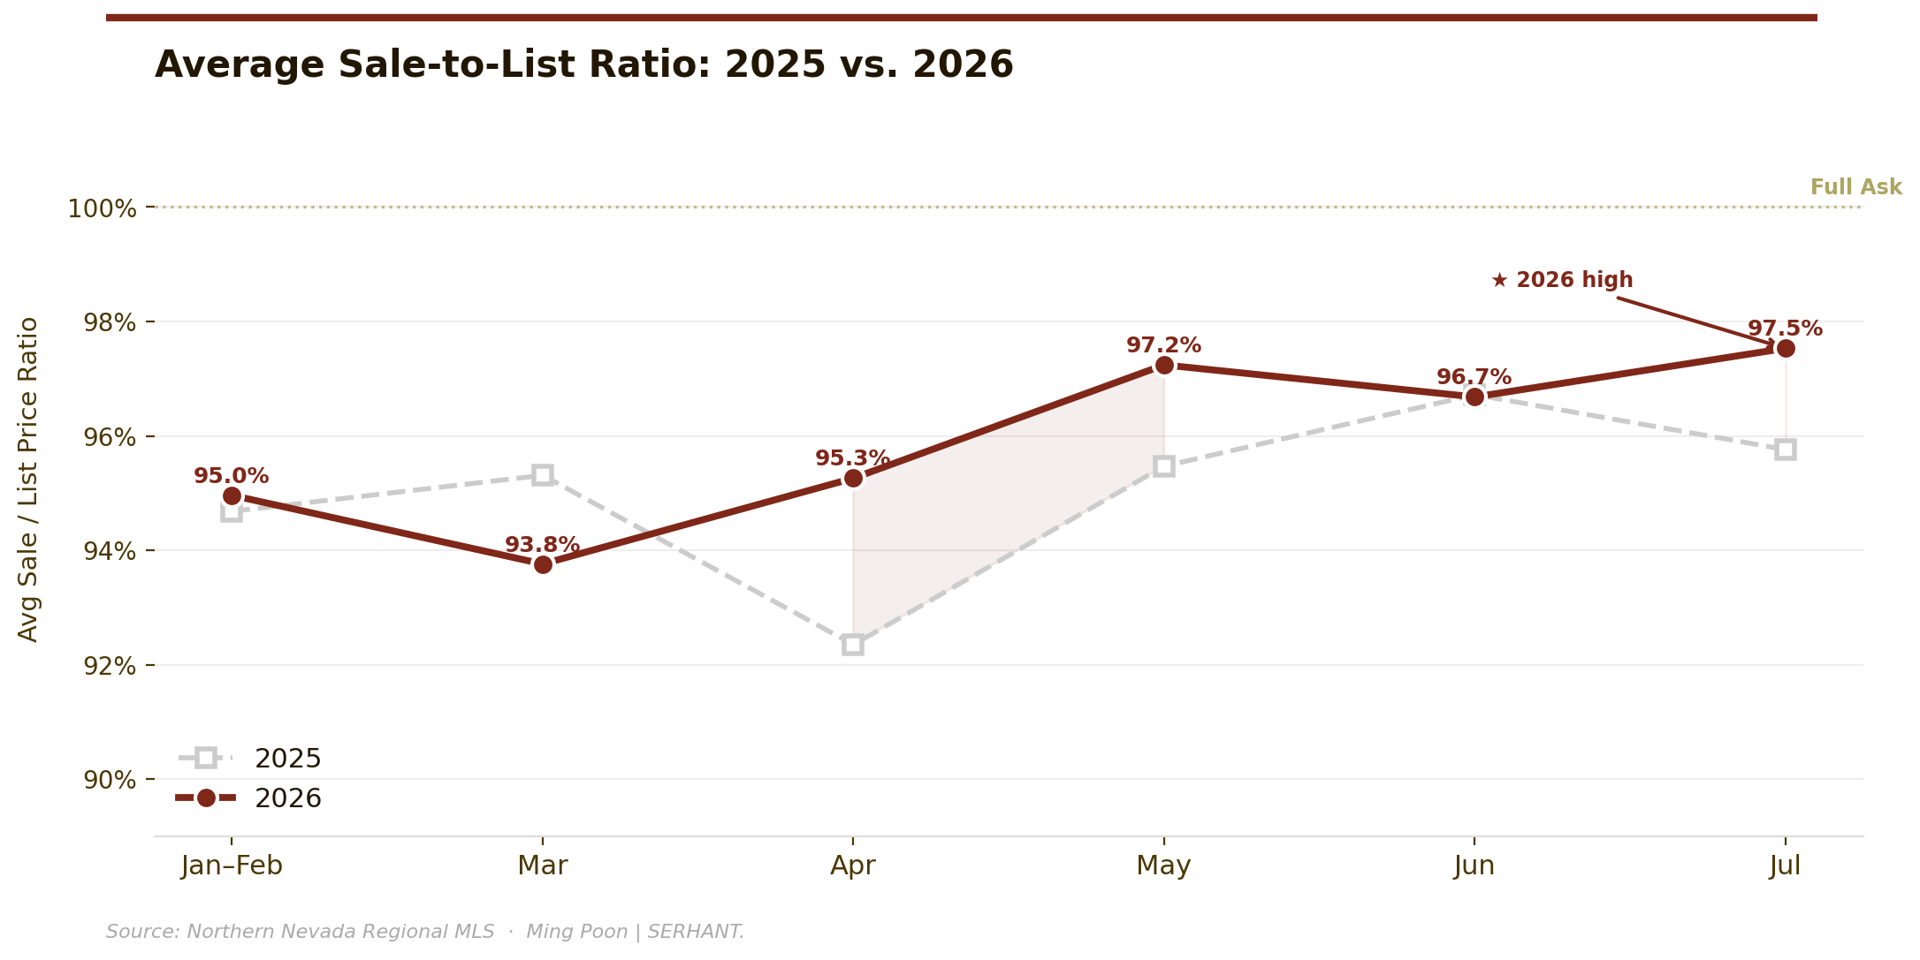
Average sale-to-list ratio by month. July 2026's 97.5% is the highest monthly reading of the year — 3 of 12 July closings transacted at or above list price.
The three July closings that came in at or above asking price span the market's full range: 539 Cole Circle at $9.25M (100% of ask), 932 Lakeshore Boulevard at $7.85M (101.3% of ask), and 344 Country Club Drive at $2.4M (102.1% of ask). Three tiers, three neighborhoods, the same signal — sellers who priced correctly and buyers with no room left to negotiate.
MARKET INSIGHT
The $2.5M–$4M Gap: A Supply Story
The absence of $2.5M–$4M closings in July is the most analytically interesting feature of the month. This is the market's most active price band — it's generated 22 closings year-to-date across January through June, the highest of any tier. But in July, not one property in this range closed.
The explanation is not that buyers evaporated. The contingent pipeline carries five properties asking $2.65M–$5.2M, all under contract. What happened is simpler: the spring inventory that was available in this range cleared. The next wave of product at these prices has not yet come to market in sufficient quantity — a seasonal inventory gap, not a structural shift.
What remains in active inventory at this range is product that has been sitting: 877 Tyner at $4.499M (37 DOM), 643 2nd Creek Drive at $3.995M (37 DOM), 581 Tyner Way at $3.689M (38 DOM), and 730 Martis Peek Drive at $3.895M (34 DOM). These are not homes that failed to find buyers — they are homes where the price-to-product relationship hasn't yet clicked for the specific buyer who would own them.
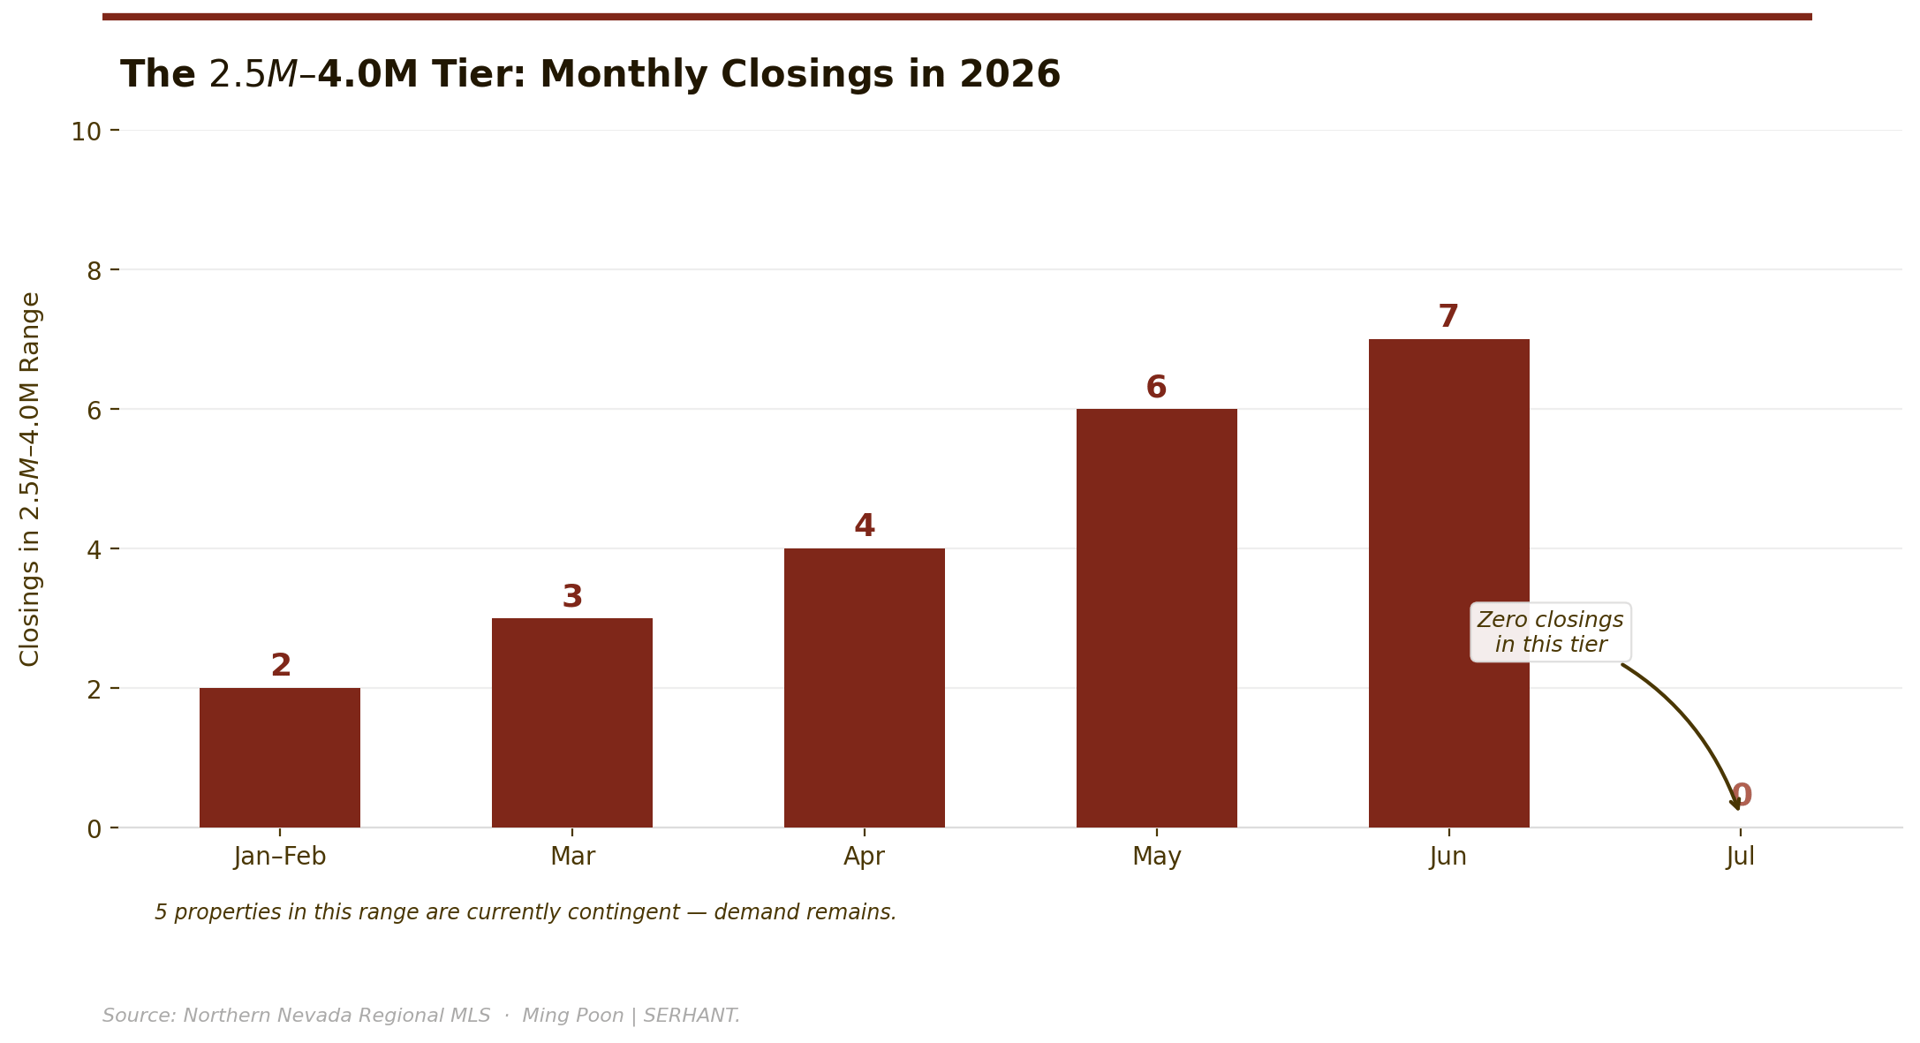
Monthly closings in the $2.5M–$4.0M tier, 2026. Five properties in this range are currently contingent.
SEGMENT ANALYSIS
Single-Family vs. Condominiums
70 of H1's closings were single-family, generating the majority of dollar volume. The core $2M–$3.5M tier continues to trade faster and at higher prices as inventory fails to keep pace with buyer interest.
Fewer transactions than a year ago, but the story is supply, not demand. Seventeen condo closings YTD reveal a market polarized between sub-$800K aging inventory and $2M–$4M estate-quality complex product.
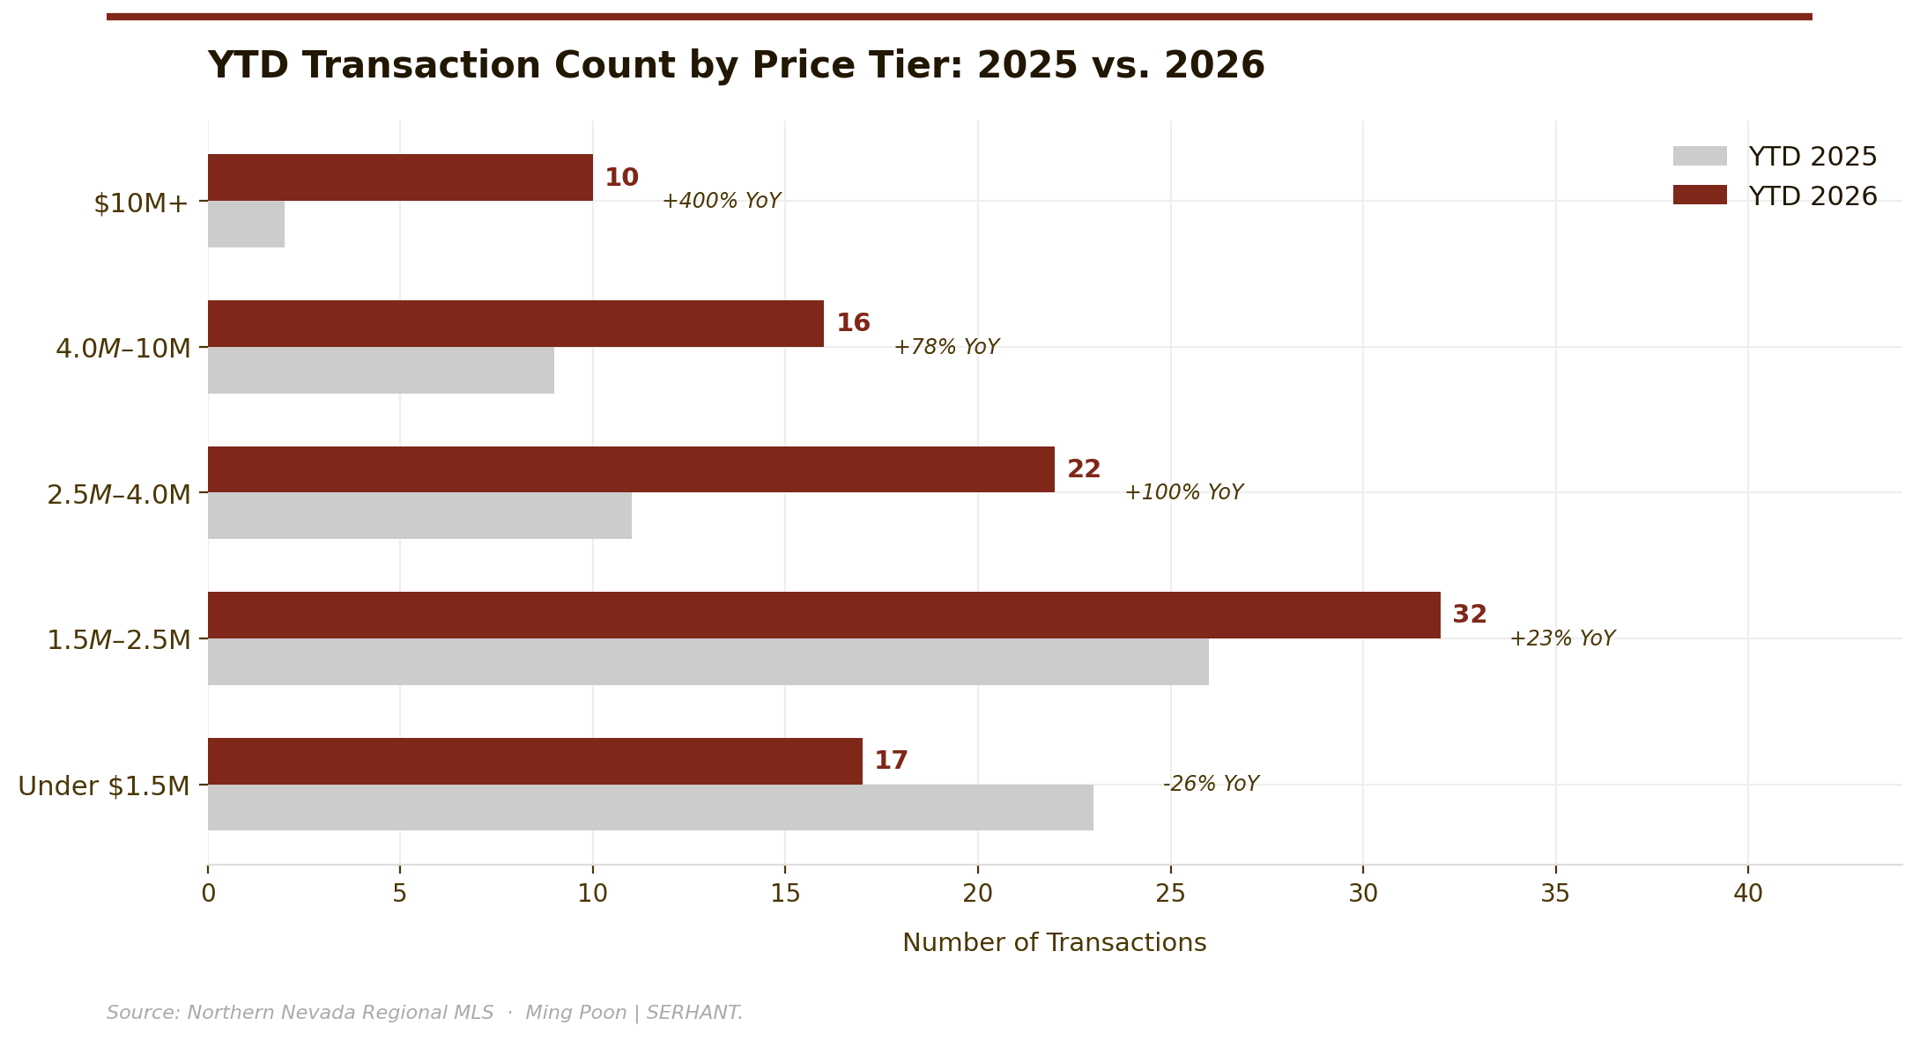
YTD transaction count by price tier, Jan–Jul 2025 vs. 2026. Every tier above $1.5M gained. The sub-$1.5M contraction reflects supply withdrawal, not weak demand.

INCLINE VILLAGE · LAKE TAHOE, NEVADA
HISTORICAL CONTEXT
July in the Arc of the Market
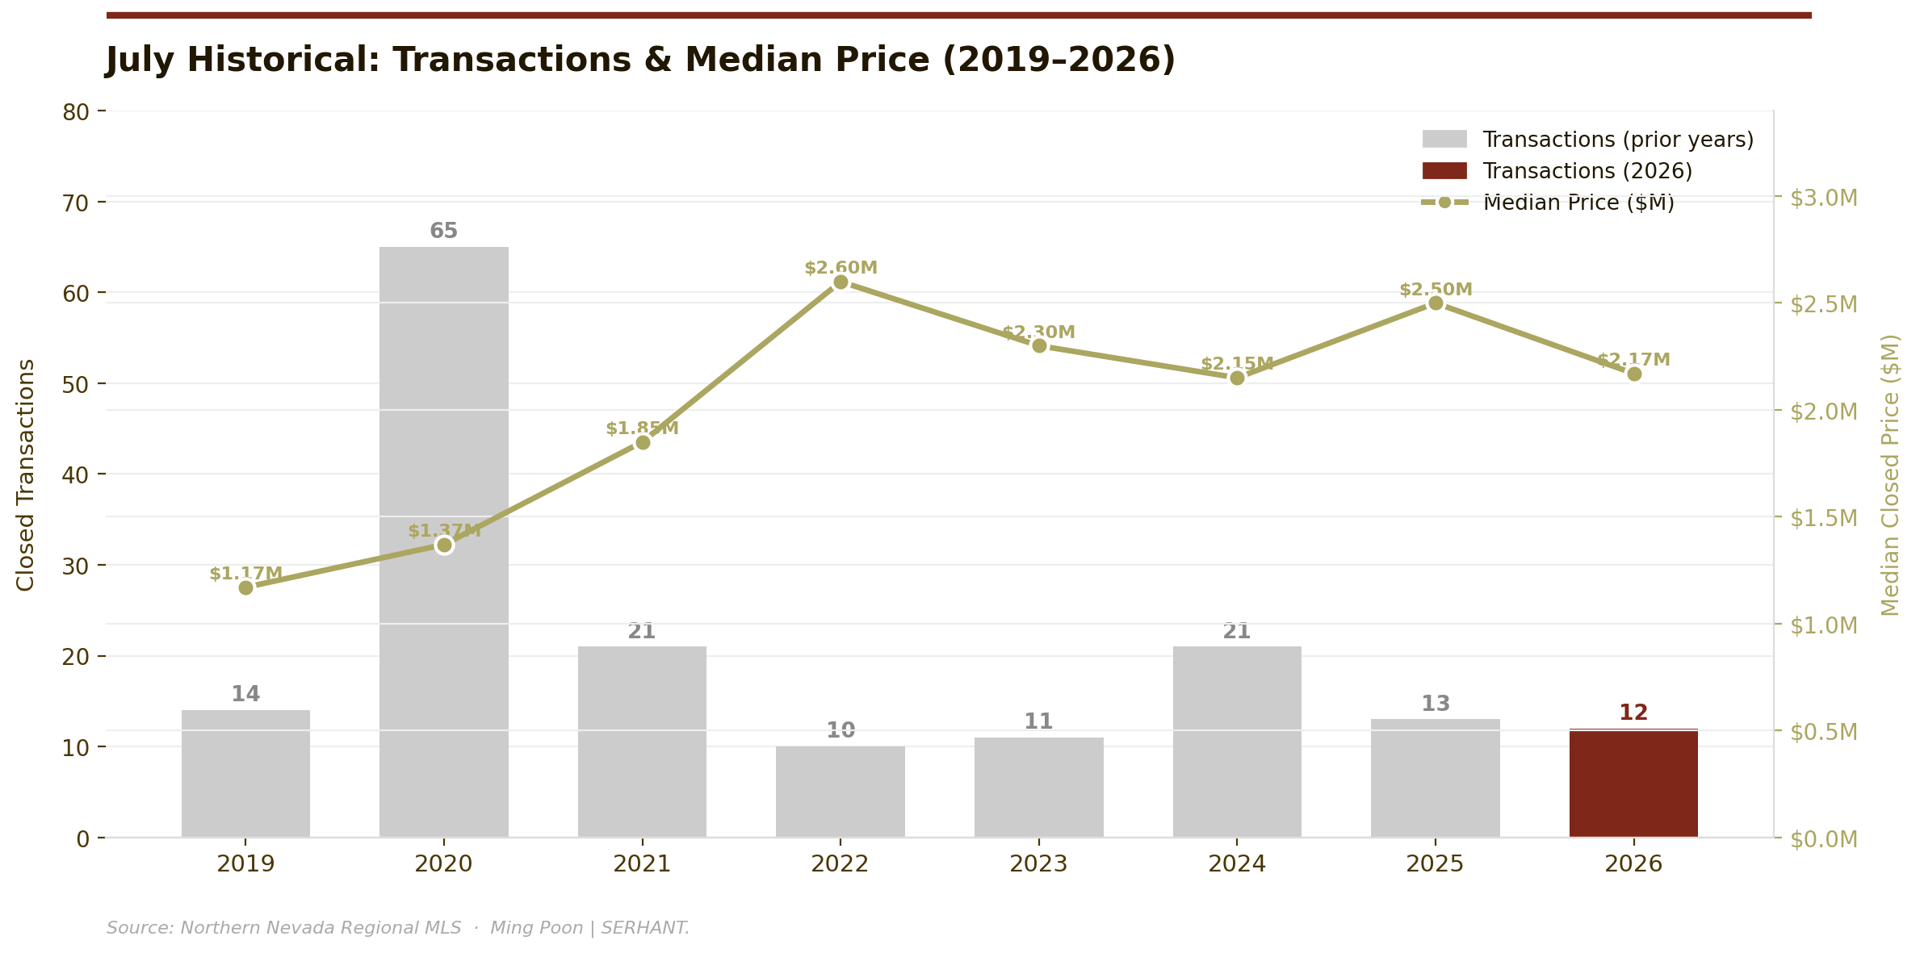
July transaction count and median price, 2019–2026. The 2020 spike (65 closings) reflects pandemic-era pent-up demand. The 2026 median of $2.175M reflects product mix, not price decline.
Seen against eight years of July data, 2026's 12 closings sit well below 2020's pandemic-driven surge but roughly in line with the more typical post-2021 range. The market's 2021 migration surge and 2023 rate-shock trough remain the two poles this cycle is measured against — 2026 sits firmly in recovery territory, closer to 2024's pace than either extreme.
The year-over-year median comparison is easy to misread. July 2025's $2.5 million median was inflated by a single $24.5 million outlier sale; strip that transaction out and the comparable 2025 median falls to roughly $1.9 million — meaningfully below July 2026's $2.175 million. Framed correctly, this July represents genuine appreciation, not the decline the headline comparison implies.
YEAR-TO-DATE SCORECARD
January–July: 2025 vs. 2026
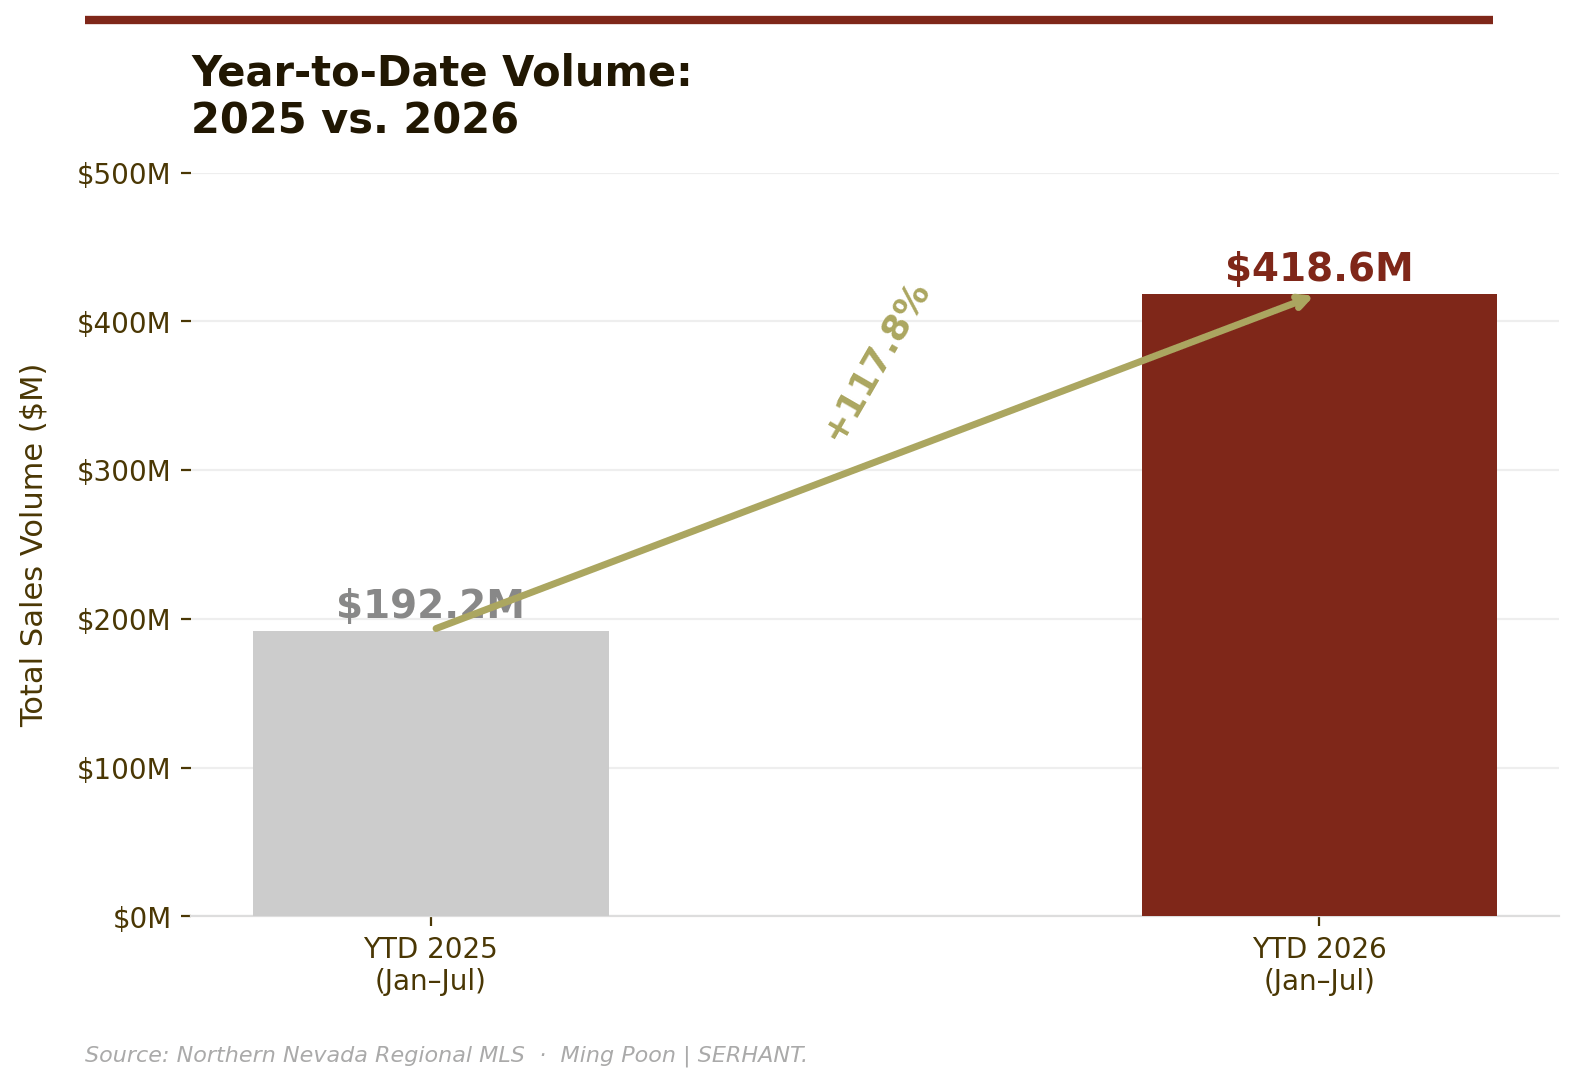
YTD sales volume, Jan–Jul 2025 vs. 2026. +117.8% year-over-year.
| Metric | 2025 | 2026 | Change |
|---|---|---|---|
| Transactions | 71 | 97 | +36.6% |
| Volume | $192.2M | $418.6M | +117.8% |
| Overall Median | $2,065,000 | $2,400,000 | +16.2% |
| SF Median | $2,130,000 | $2,695,000 | +26.5% |
| Condo Median | $1,610,000 | $1,540,000 | −4.3% |
| Median $/SqFt | $850 | $923 | +8.6% |
| Median DOM | 74 days | 61 days | −17.6% |
| Avg SP/LP Ratio | 95.2% | 96.0% | +0.8 pts |
ACTIVE PIPELINE — JULY 31, 2026
What's Under Contract. What's Still Available.
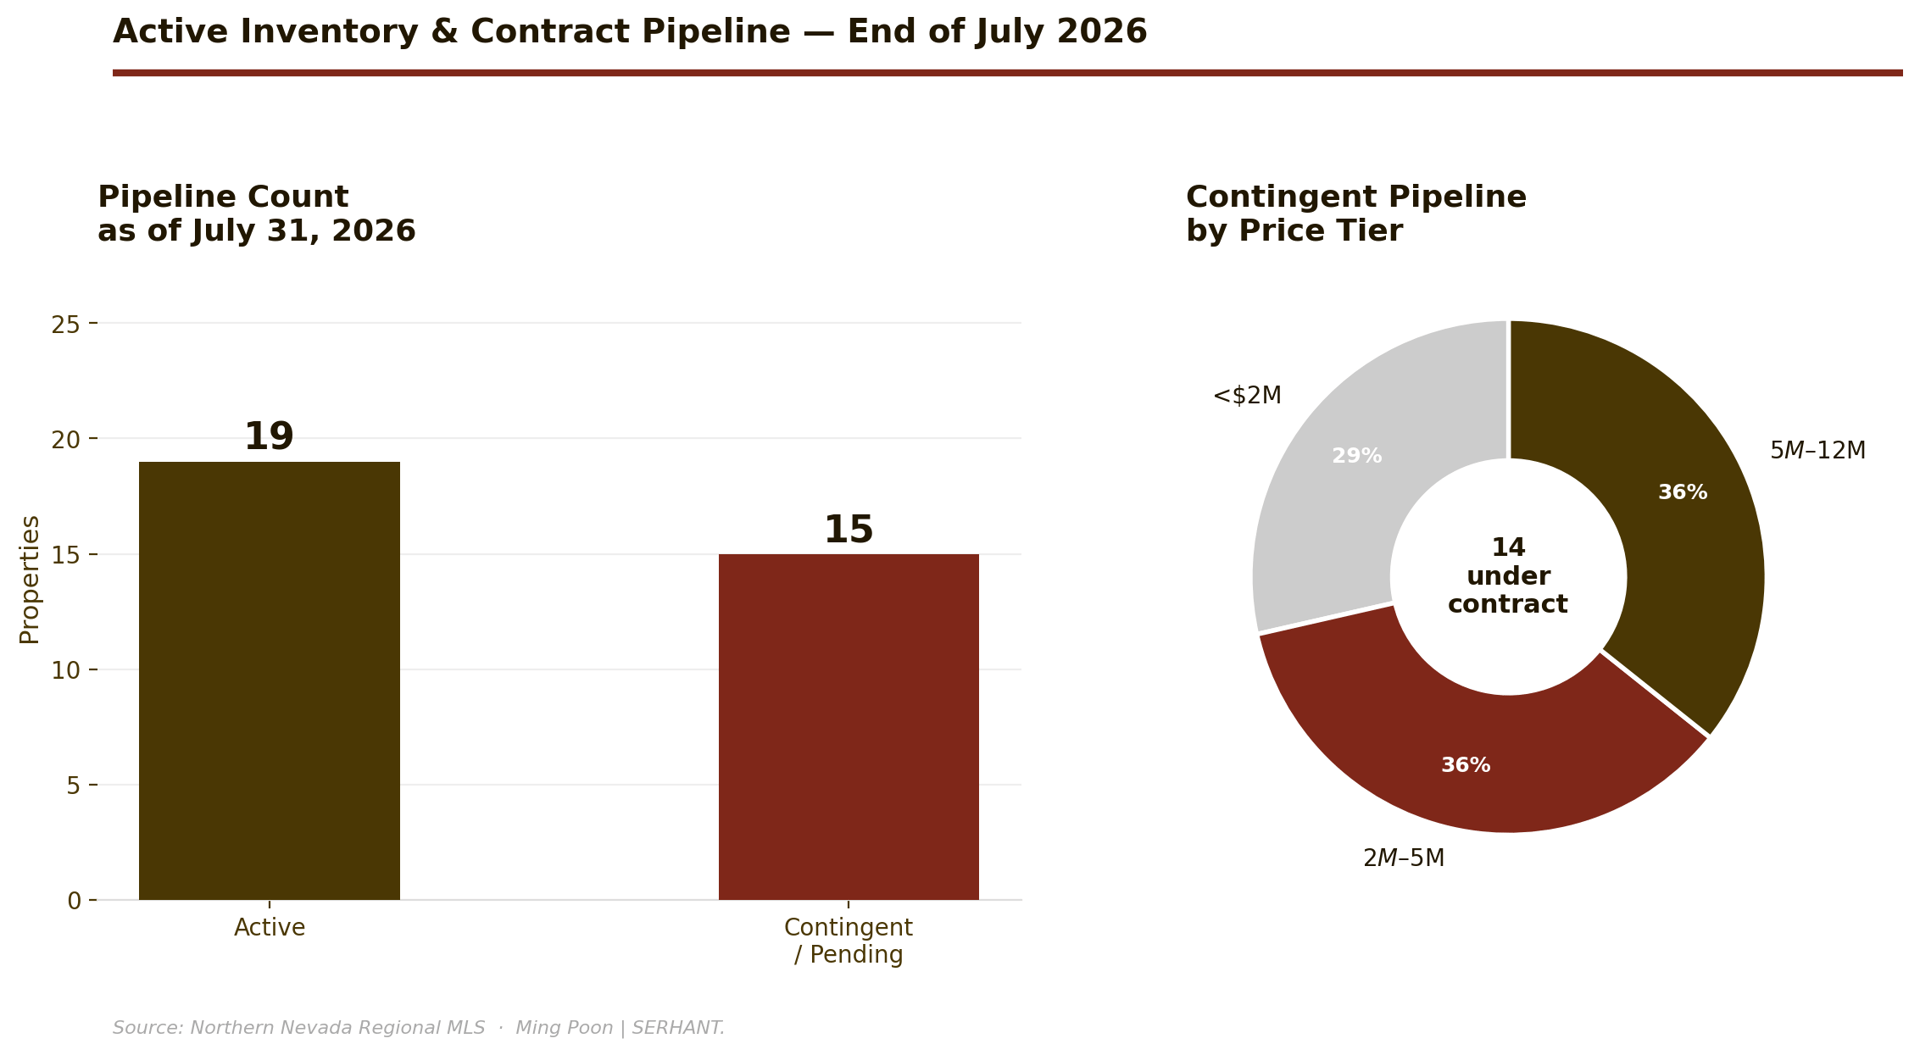
19 active listings, 15 contingent/pending as of July 31.
The July file shows 15 contingent or pending properties with a combined ask value of approximately $63M and a median list price of $3.16M — a healthy forward pipeline. If even 10 of these close in August, the month will show meaningful volume despite the mid-summer inventory gap.
The active inventory of 19 listings at a median ask of $4.4M is heavily weighted toward the luxury and ultra-luxury tier: four properties above $12M, three between $5M–$12M. August closings will likely concentrate in the sub-$4M range as contingent contracts close, with luxury inventory requiring longer runway.
"Five properties above $5M are currently contingent. If they close, that's $42M+ added to August–September."

FORWARD OUTLOOK
The Second Half Picture
"97 closings. $418.6 million in volume. Through seven months, 2026 has already surpassed the full-year volume of every year in the dataset except 2021."
Year-to-date through July, the 2026 market has generated 97 transactions — 37% more than the 71 closings recorded over the same period in 2025, and nearly 150% more volume ($418.6M vs. $192.2M). These are not incremental improvements. They represent a fundamental shift in the market's operational scale.
The $2.5M–$4M Replenishment
The band that drove the spring's transactional energy needs fresh inventory. The contingent pipeline shows buyers are ready for it; the question is whether sellers in this range recognize the window and list before the fall. Anyone considering a fall listing in this range should be under contract no later than October.
The Luxury Pipeline Resolution
Five properties above $5M are currently contingent: 757 Champagne at $11.5M, 571 Dale Drive at $9.95M, 563 Knotty Pine Drive at $8.495M, 250 Pine Cone Road at $6.95M, and 429 Valerie Court at $5.2M. If all five close, that alone adds $42M+ to August–September volume.
The Expired Listing Signal
With seven expireds in July and eight in June, we are seeing a consistent pattern of aspirationally priced listings that the market is rejecting. This is not cause for concern — it is healthy price discovery — but it does create an eventual pricing decision for those sellers.
"The Incline Village market is not slowing down. It is recalibrating — thinning its mid-market inventory, processing its luxury pipeline, and setting up for a fall that could be one of the stronger post-summer markets in recent years."
6671 S Las Vegas Blvd #210 · Las Vegas, NV 89119 · (702) 232-7678
Information sourced from the Northern Nevada Regional MLS. Deemed reliable but not guaranteed. This report is for informational purposes only and does not constitute investment, legal, or financial advice. © 2026 Ming Poon | SERHANT. All rights reserved.